Showing posts with label cycles. Show all posts

Monday, August 15, 2016

It Can’t Wait Any Longer – It's Deja Vu in the Markets

The stock market tends to repeat itself on a regular basis. Why? Because it moves mainly based on the emotions of market participants, with the exception of extreme times when the masses are moving the market with extreme fear or greed, at which point they are flooding the market with buy or sell orders to create a final pop or drop in the market just before a major market reversal.

As with everything in the universe, everything moves in cycles, periods of expansion and contraction, and there are regular wave like patterns that happen on a regular basis no matter the time frame one is reviewing on a stock chart.

Here are three charts, each showing a similar price pattern of extreme washout lows, followed by roughly a 1 1/2 month rally taking investors on a roller coaster ride from fear and complete panic to greedy "know it alls". In short [no pun intended] U.S. large cap stocks look and feel toppy here. I feel a correction is likely to take place any day now, and the big question is “how much will the stock market pullback? Will it be another 4-5% correction similar to the chart examples above? Or will it be something larger 8-15% correction?

Chris Vermeulen


Get my Daily Newsletter and Trade Signals Right Here


Stock & ETF Trading Signals

Monday, April 27, 2015

John Carter's Free eBook "How to Make Money in the Stock Market"

You probably recognize our trading partner John Carter from seeing offers to watch his wildly popular free options trading webinars. John has used these webinars and videos to teach traders some of the most advanced options trading methods imaginable.

Now John has decided to create this new eBook that will help the average home gamer learn how to trade the markets using easy to understand trading techniques that any of us can use starting right now.

In this free stock trading eBook you will learn....

 * What are the stock market life cycles that help you predict where the market is headed tomorrow

 * Find out who you are trading against and prepare to make the right moves

 * How sector rotation can be used to create steady winning trades for your trading account

 * How to avoid being impacted by high frequency traders that are manipulating other markets

 * How to properly manage your portfolio to generate consistent income within your own personal risk profile


Download the eBook and meet us in the markets putting these methods to work!

See you in the markets!
Ray's Stock World


Get John's latest FREE eBooK "How to Make Money in the Stock Market"....Just Click Here


Tuesday, April 1, 2014

SP500 ETF Trading Strategies & Plan of Attack for This Week

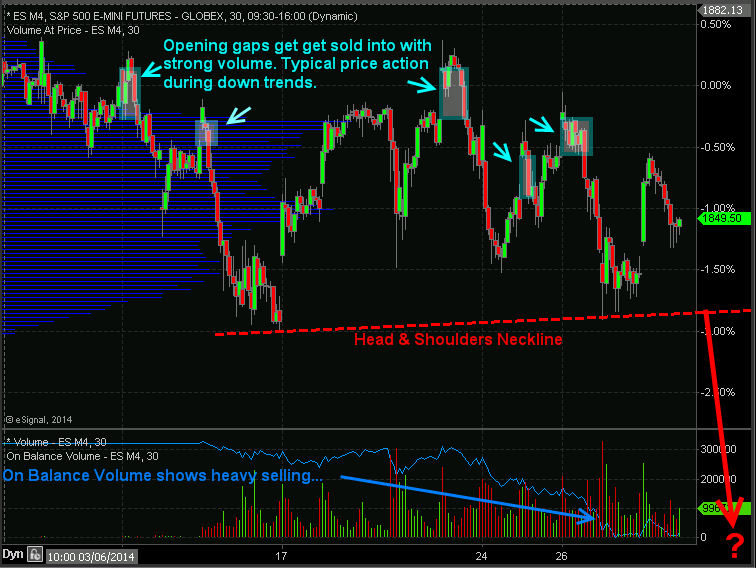
Index ETF Trading Strategies: Stocks have kick started this week with a 0.85% pop in price but the big question is if the market can hold up. Last week stocks repeatedly gap higher and sold off with strong volume telling us that institutions are slowing phasing out of stocks (distribution selling) unloading shares into strength and passing them onto the a average investor to be left holding bag.

I want to show you a couple charts which show the price action, volume and money flow of the SP500 so you have a visual of what I am talking about.

30 Minute Intraday SP500 Chart – ETF Trading Strategies

In the chart below you can see the price gaps followed by selling. Why is this important? It is important because during a down trend the market makers and big money plays who have the money and tools to manipulate the markets will allow the market drift higher or they will run price up in overnight or premarket trading when volume is light. Once the 9:30am ET opening bell rings volume and liquidity spike which allows the big money player to sell remaining long positions and or add to short positions they have.

If you look at the blue on balance volume line at the bottom of the chart you can clearly see that more contracts are being sold than bought which is typically an early warning sign that the market is about to fall farther.

ETF Trading Strategies
 

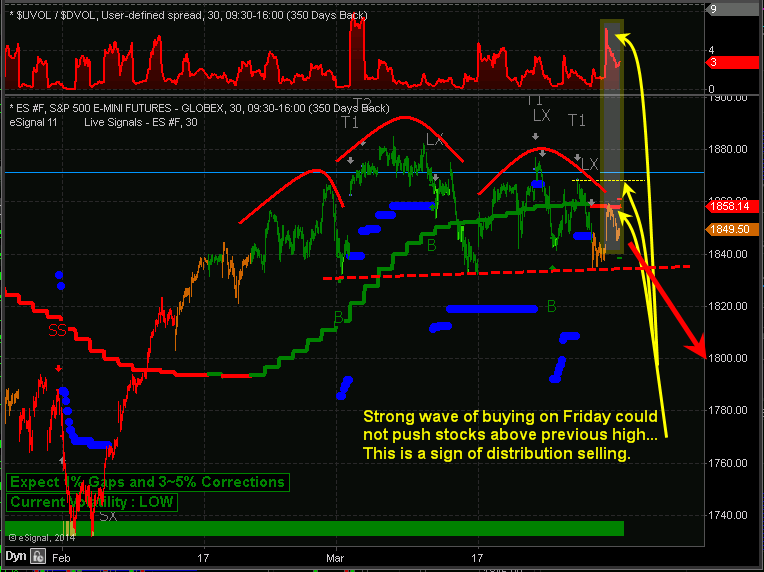
Automated Trading System – 30 Minute ES Futures Chart


Below is a marked up screen shot of my automated trading system which I use for timing both futures and ETF trading strategies. The color coded bars tell you the market trend along with the strength of buyers and sellers.

When you couple market cycles, trends, volume/money flow, along with chart patterns we can forecast and trade markets with a high degree of accuracy in terms of market direction and timing.

Automated Trading Systems
 
My Index ETF Trading Strategies Conclusion:
 
Just to be clear on the current market trend and my overall outlook let me explain a little more. Overall, the broad stock market remains in an uptrend. Thursday and Friday of last week we started getting orange bars on the chart telling us that cycles, volume, and momentum are now neutral. It’s 50/50 on which way the market will go from here, so until the market internals (cycles, volume, breadth) push the odds in our favor enough for a short sell trade or a new long entry we will not add new positions to our portfolio.

It is important to understand that nearly 75% of stocks/investments move with the broad market. So we don’t want to add more long positions when the odds are not in favor of higher prices. Trading in general is not hard to do, but creating, following, executing properly money and position management is. If you have trouble with following or creating an ETF trading strategy you can have my ETF trading system for rising, falling and sideways markets traded automatically in your trading account.

Learn more here about my Automated Trading Systems

See you in the market! 
Chris Vermeulen


Sign up for one of our Free Trading Webinars....Just Click Here!


Saturday, December 14, 2013

GOLD’s Elliott Wave Analysis Bear Cycle Coming to a Close in December

When it comes to the actual trading aspect in gold our trading partner David A. Banister Market Trend Forecast has been our go to guy. Very interesting what he is bringing us this morning.....Is GOLD’s Elliott Wave Analysis Bear Cycle Coming to a Close in December?


Our Last major Elliott Wave Analysis of Gold came in early September when Gold had touched the 1434 area, and in that analysis we called for a re-test of 1271-1285 levels. This was based on our Elliott Wave Analysis of the patterns involved since the 1923 spot highs in the fall of 2011. Our clients of course were updated on a regular basis since that public analysis and we have been looking for clues to a bottom in this Gold bear cycle from the 2011 highs.

Most recently, we noted that we are seeing patterns commiserate with what Elliott wave theory calls a “truncated 5th wave” pattern. All Bear cycles have 5 full waves to the downside from the highs, and we have been in wave 5 since the 1434 highs. The key then is determining how low that wave 5 will take you in Gold, and planning your investments and timing around that forecast.

To qualify for a truncated 5th wave, you have to have a very strong preceding 3rd wave to the downside. In this case, we had that as Gold dropped from just over 1800 per ounce to 1181 into late June 2013. As we approached the 1181 areas, we also put out a public forecast saying that Gold has indeed bottomed and should rally strong to the upside. Recently, Gold hit a bottom at 1211 spot pricing last week and that is when we began to consider a truncated 5th wave pattern.

We sent our clients about a week ago regarding this possible Elliott wave theory bottom:


If we fast forward a week later, we had Gold running up to 1261 which was the pivot resistance line we told our subscribers to watch for. We hit it on the nose and backed off to 1224 yesterday. We now expect that if GOLD holds the 1211 area, that we will again rally back up and over 1261 and then head to the 1313 resistance zone. We would like to see Gold get over 1313 and if so our targets are in the 1560 ranges for Gold in the first half of 2014.

Aggressive investors should be accumulating quality small cap gold producing and exploration, or Gold itself depending on your preference during these last few weeks of December as our Elliott Wave Analysis is signaling a bottom is near. We would again watch 1211 as a key level to hold for this possible truncated wave 5 to work out.

Click here to join Banister at Market Trend Forecast for regular Gold & SP 500 Elliott Wave Analysis updates

Monday, June 3, 2013

Seven Keys in Timing Stock Market Tops – Part II

Timing stock market tops and bottoms is risky business and we all know the more the more risk we take the more potential gain would could also made. Correctly timing a top or bottom for any investment is flat out exciting not to mention financially rewarding. But this high risk trading tactic does come with some major issues which you must FULLY understand so that you can protect your capital and self confidence.

On May 13th I wrote a special report on how to spot market tops just before they happen and how to do it with a very high probability of success. I also explain the major pit falls to be aware of so you stay on the right side of the market.

I recommend you read this special report right now.... "How to Spot and Time Stock Market Tops"

That special report truly showed you what was going to happen a few weeks before it did. Much like how this report shows you what is likely to happen in June.

Looking at the market with my YOU ARE HERE type of using cycles, volume, price patterns and momentum to forecast what is likely to unfold in the coming weeks. Depending on the time frame used for my analysis I can figure out with a high probability where price will be in a few minutes, hours or days also. Mall Market Directory – You Are Here

Stock market tops are tough to trade and time. That is because there are so many things happening in the media and emotions running wild that it’s tough to get a grasp on what you should really be focusing on to keep a level head trade around it.

Market tops are typically not an event but rather a progression that takes much longer than most individuals expect. I still find myself jumping the gun at times and I know this and have been through this process hundreds of times in various investments. The human brain is a powerful tool but emotions can force you to override your rules/strategy still.

U-R-Hear


Stop Fighting! – Bulls & Bears are BOTH Correct at this Stage

It does not matter where you go to get your stock market news and reports… Everyone is arguing their bullish or bearish case more than EVERY. There is a reason for this and it’s because the SP500, DJIA, RUT and NASDAQ appear to be entering a cycle top. What does this mean? It means the uptrend is almost over from a technical analyst point of view, and those who are have been bearish for a long time feel the market topping out more now than ever in their gut that this is the top.

Keeping it simple removing news, economic data, emotions and biases we are left with one thing which is technical analysis. This is based on price alone and that is important to remember because the only thing that pays you money for an investment is when price moves in your favor. Believe it or not price only has blips on the charts here and there which is based off news, economic data etc… In the big picture stock prices tend to lead economic data by several months and in some cases years.

So the big question is this… If price action is the only thing that pays you when trading why bother worrying about all the other opinions, news out there. That stuff only adds to the confusion and in most cases gets you on the wrong side of the market.

Timing the Market Top Conclusion:

In short, from a technical point of view the SP500 remains in an uptrend. But according to technical analysis the upside momentum is starting to slow. If we get a few more down days then the trend will flip and be down but it has not yet happened.

When the trend does reverse down you must remember that 80% of the time price will bounce back up to test near the recent highs before truly rolling over and collapsing. Think of it like a zombie movie. Just when you think you killed one it comes back to life for one last scare before its dead.

Just to touch on stock market bottoms so you do not get confused. Stock market bottoms are little different than tops so they are traded differently. I will cover them when the time comes.

Trading the market is not easy during this type of condition, which is why members and myself got long SSO on the 23rd and two days later sold out for a 3.5% gain. I am now looking to reload this week for another bounce/rally play but only time will tell if we get another setup.

The Bible for Commodity Traders....Get our free eBook on controlling your trades, money & emotions!


Sunday, May 12, 2013

Correction near but Bull Market has LONG waves to Go!

Are you using Elliot Wave theory in your trading? Today David Banister of Market Trend Forecast is laying out the Elliot formations in detail. Do yourself a favor and take a few minutes to make sure you are looking at this market through his eyes. Can any of us call the pull back exactly and reliably? No, of course not. But we should all be taking this into consideration.

The SP 500 has been on a tear as we all know especially since the SP 500 bottomed at 1343 several months ago. My work centers around forecasting using Elliott Wave Theory along with other technical indicators. This helps with projecting the short, intermediate, and longer term paths in the stock market and also precious metals. This larger picture Bull Cycle started in March of 2009 interestingly after an exact 61.8% Fibonacci retracement of the entire move from 1974 to 2000 lows to highs. At 666, we had completed a major cycle bottom with about 9 years of movement to retrace 26 years of overall bull cycle. That was a major set of 3 waves (Corrective patterns in Elliott Wave Theory) from the 2000 highs to 2002-3 lows, then 2007 highs to 2009 lows. Once that completed its work, we were free to have a huge new bull market cycle off extreme sentiment and generational lows.

It’s important to understand where we were at in March of 2009 just as much as it is today with the market at all time highs. Is this the time to bail out of stocks or do we have a lot more upside yet to go? Our short answer is there is quite a bit more upside left in the indexes, but there are multiple patterns that must take place along the way. We will try to lay those out for you here as best we can.

Elliott Wave theory in general calls for 5 full wave cycles in a Bull pattern, with 1, 3, and 5 bullish and 2 and 4 corrective. We are currently in what is often the most bullish of all the patterns, a 3rd of a 3rd of a 3rd. In English, we are in Primary wave 3 of this bull cycle which will be 5 total primary waves. We are in Major wave 3 of that Primary 3, and in the Intermediate wave 3 of Major wave 3. That is why the market continues its relentless climb. This primary wave 3 still has lots of work to do because Major wave 3 still has a 4th wave down and a 5th wave up to finish, then we need a major 4, then a major 5.

That will complete primary wave 3. This will then be followed by a Primary wave 4 cycle correction that probably lasts several months, and then a Primary wave 5 cycle to finish this part of the bull market from March 2009 generational lows… and all of that work is going to take time. Once that entire process from March 2009 has completed, then we should see a much deeper and uglier correction pattern, but we think that is at least 12 months or more away.

What everyone wants to know then is where are we at right now and what are some likely areas for pivot highs and lows ahead? We should complete this 3rd of a 3rd of a 3rd here shortly and have a wave 4 correction working off what will likely be almost 300 points of upside from SP 500 1343. We could see as much as 90-120 points of correction in the major index once this wave completes. Loosely we see 1528-1534 as a possible top and if not then maybe another 30 or so points above that maximum into early June. This should then trigger that 90-120 point correction, and then be followed by yet another run to highs.

We could go on but then we will lose our readers here for sure, and as it is… this is all projections and postulations, so it’s best to keep the forecast to the next many weeks or few months. Below is a chart we have put together showing the structure of Major wave 3 of Primary 3 since the 1343 lows. Once that Major wave 3 tops out (see the blue 3) then we will have Major 4, then Major 5 to complete Primary wave 3 since the 1074 SP 500 lows. Whew!

TMTF

Join us to get daily updates on nearer term directions of the SP 500 and Gold


Sunday, May 5, 2013

Stocks Preparing for Pullback, Buy Bad News, Sell the Good

The SP500 remains in a strong uptrend, but the index has posted a sizable gains for 2013 thus far so it’s only logical that a pullback within this bull market takes place sooner than later.

With May now upon us and historically prices fall more times than not we feel a 3-4 weeks correction is on the verge of starting. This Friday we just had very strong economic numbers confirming the economy is recovering. This news has sent stocks sharply higher as shorts cover their positions and investors who are not yet long get into position to profit from higher prices. But the herd psychology and their trades are typically incorrect as they invest based on fear and greed. The old saying is buy on negative news and sell on positive news will typically get you on the correct side of the market more times than not if used with price, volume and cycles.

The Technical Traders – SP500 Index Weekly Chart

If we look at the price of the SP500 we need it to breakdown below the recent pivot low before we become bearish. Volume which is not shown on this chart is below average as price moves higher and this is a bearish sign also.

Looking at a basic cycle using the stochastics indicator we can see that the current cycle is starting to turn down. Cycles tend to lead price during an uptrend so we could still have stocks move higher for another week or so but be aware that when price starts to drop its likely a market top. But until then you must respect the uptrend. Stocks can remain overbought and toppy looking for months… so done be gambling and trying to pick a top until we see breakdown start.

spy2

SP500 Stocks Trading Above 200 Moving Average – The Technical Traders View

Stocks trading above the 200 day moving average is a great indicator for helping spot broad market underlying strength/weakness. It does lag the market but is still very powerful. The chart below shows this info and my thinking of what is likely to unfold sooner than later though price may still rise for several days yet.

We also use a similar chart for timing swing trades and market tops which are based on stocks trading above the 20 day moving average. This chart is not shown here but is now trading at a level which generally triggers selling/market top.

spy1

Stock Market and SP500 Trading and Investing Conclusion:

In short, we are still bullish on the market as we focus on trading with the trend. We do not pick market tops and we do not pick market bottoms. Knowing that stocks make their biggest moves at the end of their uptrend and at the end of a down trend it’s only common sense that risk is extremely high if you are betting against the current trend.

The best thing to do is wait for a technical breakdown and reversal which puts the odds more in your favor with much less risk and typically a clear line in the sand to exit the position if you are incorrect.

The last major stock market top which formed in September of last year had a series of strong news and strong price action persuading the herd to buy stocks. Instead it was the last impulse wave up just before a strong correction took place. That is much like what we see now with the economic news.

Join our free newsletter and stay on right side of the market while reducing your trading/investing stress. My simple yet effective analysis walks you through the market each week without bias. Remember Price and Volume is what makes you money trading NOT news or forecasts.

Join our FREE Newsletter Today!


Check out our current specials for full subscription members.

Friday, July 13, 2012

Gold Cycles Will Soon Forecast Where Prices Are Headed

Gold and stock market forecaster have been using cycles in price that repeat every certain amount of trading days to help them spot key reversal areas in the financial market. Almost everything in life seems to go in cycles and commodity prices and the stock market are no different.

As we all know the market is very difficult to forecast when using only one set of analysis like cycles. Analyzing price action, volume, market sentiment, market breadth, trends and inter-market analysis are the other key areas which one must understand before they can be in the zone (ZEN) with the financial market and properly forecast future prices.

This report will show you just how well cycles work if applied and traded properly.


The chart below is of gold and shows its short term trading cycles. I will admit this chart is hard on the eyes and as ugly as they get to bear with me.

Three different cycles have been applied to the chart using a short, intermediate and long term cycle wave length. The general idea here is that you want to trade with the underlying trend, then use these short term cycles to profit from weekly price swings.

Gold has been in a down trend for a year so the focus should be on shorting the bounces. Focusing on selling short gold during a time with 2 or more cycles are topping as you stand a great chance of the price moving in your favor within 1-3 days.

Once the price starts to move in your favor you want to scalp to profits once the short term (green) cycle drops near a reversal level. Once this takes place I always tighten my stops to breakeven, lock in some profits and continue to wait for another cycle to reach the bottom at which point I take more profit off the table and tighten my protective stop once again.

As you can see this is not the perfect system but it makes money, and if you apply more analysis to the market you can lock in more of these moves using intraday charts, volume, and sentiment levels.


How to Find Market Cycles
You must have an analysis tool that can read the market and find cycles within it. Once you know how many days the most frequent cycles are occurring you can then use a custom cycle indicator to overlay them on the charts as seen in the gold chart above. The visual overlay is the key to spotting market reversals and areas to add to a position or trim profits. Look at the chart below for a visual of how I find my cycles.


Gold Cycle Forecast Conclusion:
In short, gold overall remains in a down trend. But from looking at the gold chart and its short term cycles I have a feeling we will be seeing price trade sideways this week and a bounce next week.
The next week will be very interesting as these cycles will actually give us an early warning if the overall gold market is about to bounce or sell off. The question is what the cycles do in the next few days while gold flirts with support…

It does take some time/experience to read the cycles and get a feel for how they move so don’t worry about it if you don’t fully grasp the idea from this short article. 

Find out more on cycles and trading at The Gold & Oil Guy.com