Showing posts with label ES. Show all posts

Monday, May 28, 2018

Technical Analysis Confirms Support Level on the SPX

This week presented some interesting price rotation after an early upside breakout Sunday night. The Asian markets opened up Sunday night with the ES, NQ and YM nearly 1% higher this week. This upside breakout resulted in a clear upside trend channel breakout that our researchers believe will continue to prompt higher price legs overall. Our researchers, at Technical Traders Ltd., have issued a number of research posts over the past few weeks showing our analysis and the upside potential in the markets that should take place over the next few weeks.

We expected a broad market rally this week, yet it has not materialized as we expected this week. We consider this a stalled upside base for a new price leg higher. Take a look at this Daily SPY chart to illustrate what we believe the markets are likely to do over the next few weeks. There are two downside price channels that have recently been broken by price (RED & YELLOW lines). Additionally, there is clear price support just below $272.00 that was recently breached. These upside price channel breakouts present a very clear picture that price is attempting to push higher and breakout from these price channels.

Current price rotation has tested and retested the price support level near $272.00 and we believe this recent “stalled price base” will launch a new upside price rally driving price well above the $280.00 level.


With the holiday weekend setting up in the U.S. and the early Summer trading levels setting up, it is not uncommon for broader market moves to execute after basing/staging has executed. This current upside price action has clearly breached previous resistance channels, so we continue to believe our earlier research is correct and the US majors will mount a broad range price advance in the near future.

The VIX, on the other hand, appears poised to break lower – back to levels below $10 as the US major price advance executes. The VIX, as a measure of volatility that is quantified by historical price trend and volatility, should continue to fall if our price predictions are correct. If the US major markets continue to climb/rally, the VIX will likely fall to levels well below $10.00 and continue to establish a low volatility basing level – just as it did before the February 2018 price correction.


A holiday weekend, the start of lighter Summer trading and the recent upside breakout of these downward price channels leads us to believe the market will continue to push higher over time with the possibility of a massive upside “melt up” playing out over the next 2 - 6+ weeks. We believe this move will drive prices to new all time price highs for the US majors and will surprise many traders that believe the recent price rotation is a major market top formation.

Our exclusive Wealth Building Newsletter provides detailed market research, daily market video analysis, detailed trading signals and much more to assist you in developing better skills and greater success in your trading. One of our recent trade in natural gas using UGAZ, [check it out here] is already up over 26% and we believe it will run another 25-50% higher from here! We provide incredible opportunities for our member’s success. We urge you to visit The Technical Traders to learn how we can assist you in finding new success.

Our 53 years experience in researching and trading makes analyzing the complex and ever changing financial markets a natural process. We have a simple and highly effective way to provide our customers with the most convenient, accurate, and timely market forecasts available today. Our stock and ETF trading alerts are readily available through our exclusive membership service via email and SMS text. Our newsletter, Technical Trading Mastery book, and 3 Hour Trading Video Course are designed for both traders and investors. Also, some of our strategies have been fully automated for the ultimate trading experience.




Stock & ETF Trading Signals

Saturday, December 30, 2017

2018 First Quarter Technical Analysis Price Forecast

As 2017 draws to a close, our analysis shows the first Quarter of 2018 should start off with a solid rally. Our researchers use our proprietary modeling and technical analysis systems to assist our members with detailed market analysis and timing triggers from expected intraday price action to a multi-month outlook.

These tools help us to keep our members informed of market trends, reversals, and big moves. Today, we are going to share some of our predictive modelings with you to show you why we believe the first three months of 2018 should continue higher.

One of our most impressive and predictive modeling systems is the Adaptive Dynamic Learning system. This system allows us to ask the market what will be the highest possible outcome of recent trading activity projected into the future. It accomplishes this by identifying Genetic Price/Pattern markers in the past and recording them into a Genome Map of price activity and probable outcomes.

This way, when we ask it to show us what it thinks will be the highest probable outcome for the future, it looks into this Genome Map, finds the closest relative Genetic Price/Pattern marker and then shows us what this Genome marker predicts as the more likely outcome.

This current Weekly chart of the SPY is showing us that the next few Weeks and Months of price activity should produce a minimum of a $5 – $7 rally. This means that we could see a continued 2~5% rally in US Equities early in 2018.


Additionally, the ES (S&P E-mini futures) is confirming this move in early 2018 with its own predictive analysis. The ADL modeling system is showing us that the ES is likely to move +100 pts from current levels before the end of the first Quarter 2018 equating to a +3.5% move (or higher). We can see from this analysis that a period of congestion or consolidation is expected near the end of January or early February 2018 – which would be a great entry opportunity.


The trends for both of these charts is strongly Bullish and the current ADL price predictions allow investors to understand the opportunities and expectations for the first three months of 2018. Imagine being able to know or understand that a predictive modeling system can assist you in making decisions regarding the next two to three months as well as assist you in planning and protecting your investments? How powerful would that technology be to you?

Our job at Technical Traders Ltd. is to assist our members in finding and executing profitable trades and to assist them in understanding market trends, reversals, and key movers. We offer a variety of analysis types within our service to support any level of a trader from novice to expert, and short term to long term investors.

Our specialized modeling systems allow us to provide one of a kind research and details that are not available anywhere else. Our team of researchers and traders are dedicated to helping us all find great success with our trading.

So, now that you know what to expect from the SPY and ES for the next few months, do you want to know what is going to happen in Gold, Silver, Bonds, FANGs, the US Dollar, Bitcoin, and more?

Join The Technical Traders Right Here to gain this insight and knowledge today.

Chris Vermeulen

Stock & ETF Trading Signals

Tuesday, April 1, 2014

SP500 ETF Trading Strategies & Plan of Attack for This Week

Index ETF Trading Strategies: Stocks have kick started this week with a 0.85% pop in price but the big question is if the market can hold up. Last week stocks repeatedly gap higher and sold off with strong volume telling us that institutions are slowing phasing out of stocks (distribution selling) unloading shares into strength and passing them onto the a average investor to be left holding bag.

I want to show you a couple charts which show the price action, volume and money flow of the SP500 so you have a visual of what I am talking about.

30 Minute Intraday SP500 Chart – ETF Trading Strategies

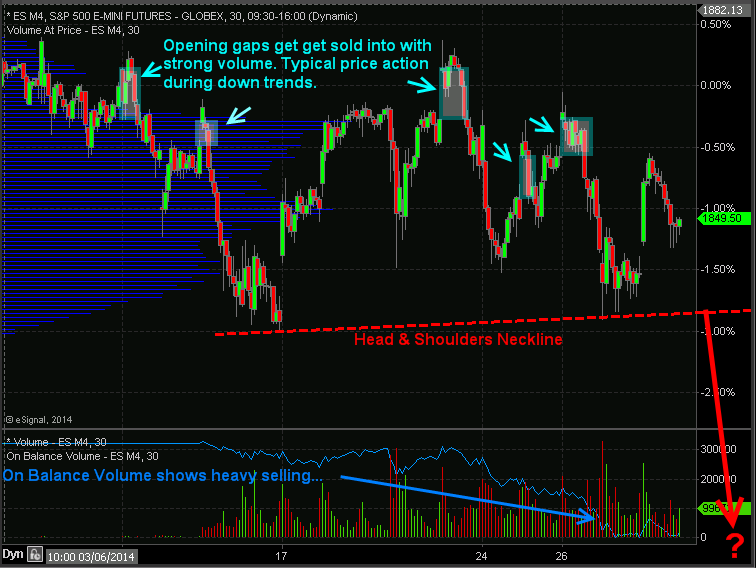
In the chart below you can see the price gaps followed by selling. Why is this important? It is important because during a down trend the market makers and big money plays who have the money and tools to manipulate the markets will allow the market drift higher or they will run price up in overnight or premarket trading when volume is light. Once the 9:30am ET opening bell rings volume and liquidity spike which allows the big money player to sell remaining long positions and or add to short positions they have.

If you look at the blue on balance volume line at the bottom of the chart you can clearly see that more contracts are being sold than bought which is typically an early warning sign that the market is about to fall farther.

ETF Trading Strategies
 

Automated Trading System – 30 Minute ES Futures Chart


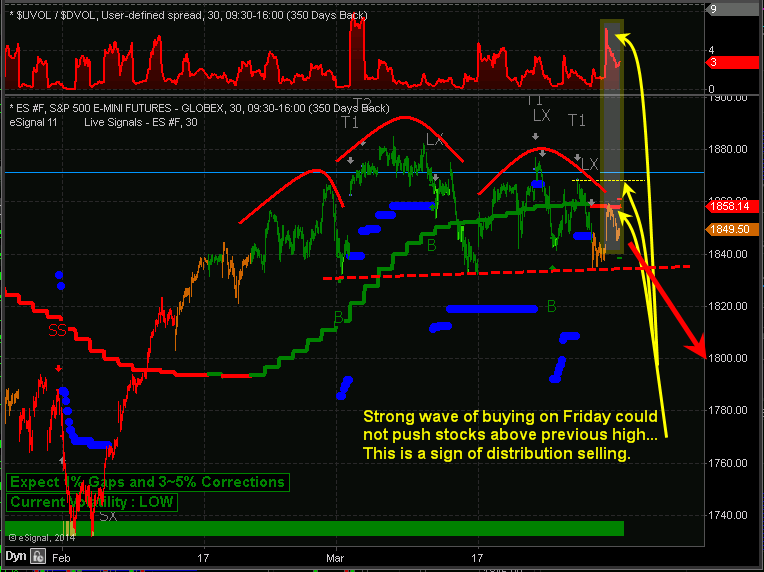
Below is a marked up screen shot of my automated trading system which I use for timing both futures and ETF trading strategies. The color coded bars tell you the market trend along with the strength of buyers and sellers.

When you couple market cycles, trends, volume/money flow, along with chart patterns we can forecast and trade markets with a high degree of accuracy in terms of market direction and timing.

Automated Trading Systems
 
My Index ETF Trading Strategies Conclusion:
 
Just to be clear on the current market trend and my overall outlook let me explain a little more. Overall, the broad stock market remains in an uptrend. Thursday and Friday of last week we started getting orange bars on the chart telling us that cycles, volume, and momentum are now neutral. It’s 50/50 on which way the market will go from here, so until the market internals (cycles, volume, breadth) push the odds in our favor enough for a short sell trade or a new long entry we will not add new positions to our portfolio.

It is important to understand that nearly 75% of stocks/investments move with the broad market. So we don’t want to add more long positions when the odds are not in favor of higher prices. Trading in general is not hard to do, but creating, following, executing properly money and position management is. If you have trouble with following or creating an ETF trading strategy you can have my ETF trading system for rising, falling and sideways markets traded automatically in your trading account.

Learn more here about my Automated Trading Systems

See you in the market! 
Chris Vermeulen


Sign up for one of our Free Trading Webinars....Just Click Here!