While we have recently suggested the US stock market is poised for further upside price activity with a moderately strong upside price “bias”, our researchers continue to believe the U.S. stock markets will not break out to the upside until the Russell 2000 breaks the current price channel, Bull Flag, formation. Even though the U.S. stock markets open with a gap higher this week, skilled traders must pay attention to how the Mid-Caps and the Russell 2000 are moving throughout this move.
As we continue to advise our clients that the upside pricing cycle in the U.S. stock market is being underestimated, see this research post: we also believe that increased volatility and price rotation will continue to drive larger rotations in price before the final breakout upside move takes place. We want to continue to warn traders that we still don’t have any confirmed upside breakout with price continuing to stay within this price channel in the Russell 2000. Eventually, when and if the price does breakout to the upside, we will have a very clear indication that continued higher prices and a larger upside move is happening. Until then, we need to stay cautious about the types and levels of rotation that continue within the markets.
Recently, volatility has started to increase as can be seen in this VIX chart. If the Russell 2000 is not able to break this trend channel with this current upside price move, then we fully expect continued price rotation in the U.S. stock markets and another increase in the VIX as this rotation takes place. The NQ recently rotated downward by nearly 4% while historical volatility continues to narrow. When volatility diminishes in extended price trends, we’ve learned to expect aggressive price rotation can become more of a concern. We expect the VIX to spike above 16~18 on moderate volatility as we get closer to the cycle inflection date near June/July 2019.
Overall, our researchers believe the upside price bias in the U.S. stock market will continue for another 30+ days as our research and predictions regarding precious metals and the longer term equities price cycles continue to play out. Skilled traders need to be aware that this upside price bias may include larger price rotation and volatility as we get closer to the May/June/July 2019 cycle inflection points. Stay aware of the risks as 4~6%+ price rotations should be expected over the next 30+ days throughout this upside price bias.
Do you want to find a team of dedicated researchers and traders that can help you find and execute better trades in 2019 and beyond? Please visit The Technical Traders to learn how we can help you prepare for the big moves in the global markets and find better opportunities for greater success in the future. Our team of researchers and traders continue to scan the markets for new trades and unique opportunities.
Chris Vermeulen
Showing posts with label upside. Show all posts
Tuesday, April 9, 2019
Wednesday, August 15, 2018
Is Solar Rising From the Ashes Again?
Recently, the Solar Energy sector has popped up on our watch-list of potential sectors to pay attention to. Over the past few weeks, the Solar Energy sector has been under some pricing pressure and has retraced nearly 50% of the previous trend across the sector. We, the research team at Technical Traders Ltd. understand the Trade War and uncertainty resulting from geopolitical tensions can sometimes create opportunities in the markets for all traders/investors. We just have to be smart enough to find them end execute them efficiently.
Is Solar Energy the next big trend to hit in the Energy sector? What is the potential for these stocks to move 10%, 20% or even 30%+ higher? Let’s take a look.
This first chart, a Weekly chart of First Solar (FSLR) presents us with an interesting price setup. After a dramatic price decline in May and June of 2018, the price decline abruptly halted near $52.00. In fact, this downside move ended almost as if prices “legged down” to the last known true support level. Historically, looking all the way back to the lows of 2012, this downside move represents just a little over a 38.2% retracement from the highs and coincides almost perfectly with a 50% retracement from the lows in 2017. These two numbers interest us because they show us that $53.50~55.00 is very likely a strong support level that is currently being tested.
Simple Fibonacci expansion analysis tells us any upside potential could target $61.35 (+12.65%), 69.95 (+28.44%) & 76.20 (+39.99%). These levels don’t take into consideration the potential for new breakout highs above $82.50. If this were to happen, we could see a +50% or more price upside happen.
Before we get too far ahead of ourselves, what would cause the Solar sector to begin a price advance at this stage in the economy? Renewed interest in the new technology of new infrastructure/government contracts? Replacing older technology with newer, higher performance, technology? Renewed interest from personal and corporate clients? What could cause this move?
You may remember that we’ve been suggesting that capital, cash, is always attempting to find solid sources of growth and opportunity while avoiding risk and depreciation. We’ve been suggesting that the spare cash on the planet has been rushing into the US stock markets by the boatload to take advantage of the strong dollar and the strong US stock market values. Could it be time for that capital to shift away from the FANGs and other leaders and move back into opportunistic equities that are somewhat off the radar?
Earnings for these companies for Q3 are set to be announced near October 28, 2018. With FSLR, the Q3 earnings have typically been fairly strong. One could attempt to assume Q3 2018 sales value may surprise the markets again and this could be a good time to consider the Solar Sector as an opportunity.
Our next chart is a Weekly ETF chart of INVESCO SOLAR (TAN). This chart presents a similar picture as the previous chart – a relatively strong pullback from April~June of 2018. The price pullback ends near a 50% Fibonacci retracement level and coincides quite nicely with our Tesla Vibrational Price Arc. We’ve drawn an arrow on the chart that suggests where we believe prices could be headed as long at this $21.75 support level holds.
Again, it does not take a genius to understand that any price advance from the $22.70 level to above $26.00 (or higher) would represent an almost +15% move. Any move above $28.00 from current levels would represent a +23.34% move. There is room for profits if our analysis is correct.
Lastly, we want to highlight what might be the most interesting setup in the Solar sector so far – Canadian Solar Inc (CSIQ). This Monthly chart attempt to show our readers exactly what has been transpiring in the Solar Sector for the past 5+ years. After peaking in early 2014, Solar technology lost its sparkle with investors. Slowly, over time, prices waned and dropped while attempting to find support. Technically, we view that support as the lows established in 2016 (prior to and near the US Presidential elections).
After that point it time, it is pretty clear to see that some renewed interest in the Solar Sector began to take place. Slowly, price advanced from the low as volume stayed somewhat muted. New rotational highs were established while the most recent low is still testing the 2016 lows. This tells us that the price trend, at least until we see a new breakdown low, is attempting to move higher.
CSIQ is currently trading near $14.75 and has upside potential above $21.00 on a breakout move. We are not saying this is definitely going to happen, but we do believe the Solar sector is setting up for an upside move and we do believe the potential for a new rotational high price to be established is quite strong. This means, finding the proper entry point and understanding the downside risk of these trades is critical.
Once CSIQ breaks our Red downward price sloping line, we would assume the price channel has been broken and we would expect the price to begin to rise dramatically.
As a member of our subscription services, you will be alerted to these, and other triggers, as our research team identifies them for the best chances at future success.
Please take a minute to visit The Technical Traders to learn how we can help you find new opportunities in the markets and stay ahead of these trends. Our most recent trade in UDOW returned 12.6% for our members last week. Please take a few minutes to understand how a small, dedicated, team of researchers with 53+ years of experience can make a difference in your future.
Is Solar Energy the next big trend to hit in the Energy sector? What is the potential for these stocks to move 10%, 20% or even 30%+ higher? Let’s take a look.
This first chart, a Weekly chart of First Solar (FSLR) presents us with an interesting price setup. After a dramatic price decline in May and June of 2018, the price decline abruptly halted near $52.00. In fact, this downside move ended almost as if prices “legged down” to the last known true support level. Historically, looking all the way back to the lows of 2012, this downside move represents just a little over a 38.2% retracement from the highs and coincides almost perfectly with a 50% retracement from the lows in 2017. These two numbers interest us because they show us that $53.50~55.00 is very likely a strong support level that is currently being tested.
Simple Fibonacci expansion analysis tells us any upside potential could target $61.35 (+12.65%), 69.95 (+28.44%) & 76.20 (+39.99%). These levels don’t take into consideration the potential for new breakout highs above $82.50. If this were to happen, we could see a +50% or more price upside happen.
Before we get too far ahead of ourselves, what would cause the Solar sector to begin a price advance at this stage in the economy? Renewed interest in the new technology of new infrastructure/government contracts? Replacing older technology with newer, higher performance, technology? Renewed interest from personal and corporate clients? What could cause this move?
You may remember that we’ve been suggesting that capital, cash, is always attempting to find solid sources of growth and opportunity while avoiding risk and depreciation. We’ve been suggesting that the spare cash on the planet has been rushing into the US stock markets by the boatload to take advantage of the strong dollar and the strong US stock market values. Could it be time for that capital to shift away from the FANGs and other leaders and move back into opportunistic equities that are somewhat off the radar?
Earnings for these companies for Q3 are set to be announced near October 28, 2018. With FSLR, the Q3 earnings have typically been fairly strong. One could attempt to assume Q3 2018 sales value may surprise the markets again and this could be a good time to consider the Solar Sector as an opportunity.
Our next chart is a Weekly ETF chart of INVESCO SOLAR (TAN). This chart presents a similar picture as the previous chart – a relatively strong pullback from April~June of 2018. The price pullback ends near a 50% Fibonacci retracement level and coincides quite nicely with our Tesla Vibrational Price Arc. We’ve drawn an arrow on the chart that suggests where we believe prices could be headed as long at this $21.75 support level holds.
Again, it does not take a genius to understand that any price advance from the $22.70 level to above $26.00 (or higher) would represent an almost +15% move. Any move above $28.00 from current levels would represent a +23.34% move. There is room for profits if our analysis is correct.
Lastly, we want to highlight what might be the most interesting setup in the Solar sector so far – Canadian Solar Inc (CSIQ). This Monthly chart attempt to show our readers exactly what has been transpiring in the Solar Sector for the past 5+ years. After peaking in early 2014, Solar technology lost its sparkle with investors. Slowly, over time, prices waned and dropped while attempting to find support. Technically, we view that support as the lows established in 2016 (prior to and near the US Presidential elections).
After that point it time, it is pretty clear to see that some renewed interest in the Solar Sector began to take place. Slowly, price advanced from the low as volume stayed somewhat muted. New rotational highs were established while the most recent low is still testing the 2016 lows. This tells us that the price trend, at least until we see a new breakdown low, is attempting to move higher.
CSIQ is currently trading near $14.75 and has upside potential above $21.00 on a breakout move. We are not saying this is definitely going to happen, but we do believe the Solar sector is setting up for an upside move and we do believe the potential for a new rotational high price to be established is quite strong. This means, finding the proper entry point and understanding the downside risk of these trades is critical.
Once CSIQ breaks our Red downward price sloping line, we would assume the price channel has been broken and we would expect the price to begin to rise dramatically.
As a member of our subscription services, you will be alerted to these, and other triggers, as our research team identifies them for the best chances at future success.
Please take a minute to visit The Technical Traders to learn how we can help you find new opportunities in the markets and stay ahead of these trends. Our most recent trade in UDOW returned 12.6% for our members last week. Please take a few minutes to understand how a small, dedicated, team of researchers with 53+ years of experience can make a difference in your future.
Monday, May 28, 2018
Technical Analysis Confirms Support Level on the SPX
This week presented some interesting price rotation after an early upside breakout Sunday night. The Asian markets opened up Sunday night with the ES, NQ and YM nearly 1% higher this week. This upside breakout resulted in a clear upside trend channel breakout that our researchers believe will continue to prompt higher price legs overall. Our researchers, at Technical Traders Ltd., have issued a number of research posts over the past few weeks showing our analysis and the upside potential in the markets that should take place over the next few weeks.
We expected a broad market rally this week, yet it has not materialized as we expected this week. We consider this a stalled upside base for a new price leg higher. Take a look at this Daily SPY chart to illustrate what we believe the markets are likely to do over the next few weeks. There are two downside price channels that have recently been broken by price (RED & YELLOW lines). Additionally, there is clear price support just below $272.00 that was recently breached. These upside price channel breakouts present a very clear picture that price is attempting to push higher and breakout from these price channels.
Current price rotation has tested and retested the price support level near $272.00 and we believe this recent “stalled price base” will launch a new upside price rally driving price well above the $280.00 level.
With the holiday weekend setting up in the U.S. and the early Summer trading levels setting up, it is not uncommon for broader market moves to execute after basing/staging has executed. This current upside price action has clearly breached previous resistance channels, so we continue to believe our earlier research is correct and the US majors will mount a broad range price advance in the near future.
The VIX, on the other hand, appears poised to break lower – back to levels below $10 as the US major price advance executes. The VIX, as a measure of volatility that is quantified by historical price trend and volatility, should continue to fall if our price predictions are correct. If the US major markets continue to climb/rally, the VIX will likely fall to levels well below $10.00 and continue to establish a low volatility basing level – just as it did before the February 2018 price correction.
A holiday weekend, the start of lighter Summer trading and the recent upside breakout of these downward price channels leads us to believe the market will continue to push higher over time with the possibility of a massive upside “melt up” playing out over the next 2 - 6+ weeks. We believe this move will drive prices to new all time price highs for the US majors and will surprise many traders that believe the recent price rotation is a major market top formation.
Our exclusive Wealth Building Newsletter provides detailed market research, daily market video analysis, detailed trading signals and much more to assist you in developing better skills and greater success in your trading. One of our recent trade in natural gas using UGAZ, [check it out here] is already up over 26% and we believe it will run another 25-50% higher from here! We provide incredible opportunities for our member’s success. We urge you to visit The Technical Traders to learn how we can assist you in finding new success.
Our 53 years experience in researching and trading makes analyzing the complex and ever changing financial markets a natural process. We have a simple and highly effective way to provide our customers with the most convenient, accurate, and timely market forecasts available today. Our stock and ETF trading alerts are readily available through our exclusive membership service via email and SMS text. Our newsletter, Technical Trading Mastery book, and 3 Hour Trading Video Course are designed for both traders and investors. Also, some of our strategies have been fully automated for the ultimate trading experience.
We expected a broad market rally this week, yet it has not materialized as we expected this week. We consider this a stalled upside base for a new price leg higher. Take a look at this Daily SPY chart to illustrate what we believe the markets are likely to do over the next few weeks. There are two downside price channels that have recently been broken by price (RED & YELLOW lines). Additionally, there is clear price support just below $272.00 that was recently breached. These upside price channel breakouts present a very clear picture that price is attempting to push higher and breakout from these price channels.
Current price rotation has tested and retested the price support level near $272.00 and we believe this recent “stalled price base” will launch a new upside price rally driving price well above the $280.00 level.
With the holiday weekend setting up in the U.S. and the early Summer trading levels setting up, it is not uncommon for broader market moves to execute after basing/staging has executed. This current upside price action has clearly breached previous resistance channels, so we continue to believe our earlier research is correct and the US majors will mount a broad range price advance in the near future.
The VIX, on the other hand, appears poised to break lower – back to levels below $10 as the US major price advance executes. The VIX, as a measure of volatility that is quantified by historical price trend and volatility, should continue to fall if our price predictions are correct. If the US major markets continue to climb/rally, the VIX will likely fall to levels well below $10.00 and continue to establish a low volatility basing level – just as it did before the February 2018 price correction.
A holiday weekend, the start of lighter Summer trading and the recent upside breakout of these downward price channels leads us to believe the market will continue to push higher over time with the possibility of a massive upside “melt up” playing out over the next 2 - 6+ weeks. We believe this move will drive prices to new all time price highs for the US majors and will surprise many traders that believe the recent price rotation is a major market top formation.
Our exclusive Wealth Building Newsletter provides detailed market research, daily market video analysis, detailed trading signals and much more to assist you in developing better skills and greater success in your trading. One of our recent trade in natural gas using UGAZ, [check it out here] is already up over 26% and we believe it will run another 25-50% higher from here! We provide incredible opportunities for our member’s success. We urge you to visit The Technical Traders to learn how we can assist you in finding new success.
Our 53 years experience in researching and trading makes analyzing the complex and ever changing financial markets a natural process. We have a simple and highly effective way to provide our customers with the most convenient, accurate, and timely market forecasts available today. Our stock and ETF trading alerts are readily available through our exclusive membership service via email and SMS text. Our newsletter, Technical Trading Mastery book, and 3 Hour Trading Video Course are designed for both traders and investors. Also, some of our strategies have been fully automated for the ultimate trading experience.
Labels:
Chris Vermeulen,
downside,
ES,
Investors,
Natural Gas,
NQ,
rotation,
SPY,
strategies,
Trading,
upside,
VIX,
YM
Saturday, June 21, 2014
WTI Crude Oil on the Move $112 Next Stop
The energy sector has surged during the last two months which can be seen by looking at the XLE Energy Select Sector Fund. If crude oil continues to climb to the $112 level, XLE will likely continue to rally for another few days or possibly week as energy stocks are considered a leveraged way to play energy price movements.
Another way to look at this info is through the USO United States Oil Fund. This tracks much closer to the price of oil. The only issue is that many ETFs that “try to track” an underlying commodity is in how the funds are built. They own multiple contracts further into the future which does not exactly provide us with the short term news/event driven price movements in the current front month contract as they should.
What does this mumbo jumbo mean? Well, it means funds like USO and the highly respected UNG, and VIX ETFs… (just joking about the highly respected part), fail to track the underlying commodity or index very well when it comes to short term price movements. This means, you can nail the timing of a trade, and the commodity or index will move in your favor, yet your fund loses money, or goes nowhere...
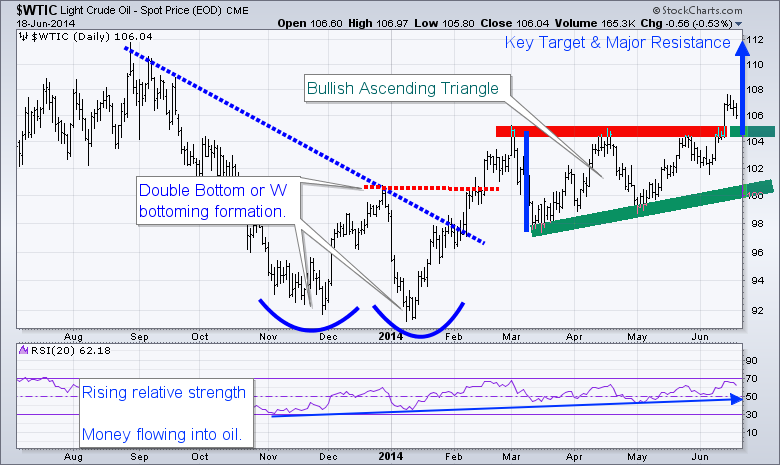
The range of the ascending triangle provides us with a measured move to the upside which is $112. Typically the first pullback after a breakout can be bought. The first short term target to scalp some gains would be $109, and at that point moving your stop to breakeven is a wise decision. Trading is all about managing capital and risk, if you don’t, then the market will take advantage of your lack in discipline.
Looking further back on the chart, you can see the double bottom formation also known as a “W” formation. Once the high of the “W” formation is broken the trend should be considered neural or up.
Also note that the RSI (relative strength) has been trending higher for some time now. This means money is rotating into this commodity. This is in line with my interview this week with Kerry Lutz and my recent article talking about the next bull market in commodities and the TSX (Toronto Stock Exchange).
Happy Trading,
Chris Vermeulen
Another way to look at this info is through the USO United States Oil Fund. This tracks much closer to the price of oil. The only issue is that many ETFs that “try to track” an underlying commodity is in how the funds are built. They own multiple contracts further into the future which does not exactly provide us with the short term news/event driven price movements in the current front month contract as they should.
What does this mumbo jumbo mean? Well, it means funds like USO and the highly respected UNG, and VIX ETFs… (just joking about the highly respected part), fail to track the underlying commodity or index very well when it comes to short term price movements. This means, you can nail the timing of a trade, and the commodity or index will move in your favor, yet your fund loses money, or goes nowhere...
Let’s Focus on the Technicals Now….
WTI crude oil has formed a bullish ascending triangle pattern from March to May of this year. The breakout to the upside is bullish and should be traded that way until the chart says otherwise. This breakout and first pullback must hold, or I will consider it a failed breakout. So if price dips and closes 2 days below the breakout level, it will be a major negative for oil in my opinion.
The range of the ascending triangle provides us with a measured move to the upside which is $112. Typically the first pullback after a breakout can be bought. The first short term target to scalp some gains would be $109, and at that point moving your stop to breakeven is a wise decision. Trading is all about managing capital and risk, if you don’t, then the market will take advantage of your lack in discipline.
Looking further back on the chart, you can see the double bottom formation also known as a “W” formation. Once the high of the “W” formation is broken the trend should be considered neural or up.
Also note that the RSI (relative strength) has been trending higher for some time now. This means money is rotating into this commodity. This is in line with my interview this week with Kerry Lutz and my recent article talking about the next bull market in commodities and the TSX (Toronto Stock Exchange).
WTI Crude Oil Trading Conclusion:
In short, oil has some extra risk around it. The recent move has been partly fueled by news overseas. So at any time oil could get a lift or take a hit by news that hits the wires. I tent to trade news related events with much less capital than I normally do because of this risk.
Happy Trading,
Chris Vermeulen
WANT MORE TRADE IDEAS? GET THEM HERE: THE GOLD & OIL GUY.COM
Saturday, July 14, 2012
What the GLD ETF Chart tells us about GOLD
How to Buy Dips and Sell Rips in Gold Using Cycle Analysis
Gold had remained in a rough 1550-1640 range for several weeks now. Tonight, we look at the GLD ETF, which represents the Gold spot price movements. Over the past 5 months we can see in the chart below the clear downtrend lines.
Recently, in the past 6 weeks we have seen a series of 3 higher lows including today where a lower gap filled in and then Gold reversed upwards.
What Gold needs to do, in terms of this GLD ETF is clear the 158 hurdle on a closing basis to set up a stage for a new advance. I would expect in the intervening months to October for Gold to continuing meandering and correcting to as low as 1445-1455, my longstanding Gold worst case low targets I’ve had since last September.
Near term key levels are 150 on the downside and 158 on the upside. If we close below 150 on GLD ETF then we should be looking for my 1445-1455 areas to be hit this summer before a low. If we clear 158 on the GLD ETF, then the triple bottom at 1520 is likely confirmed and we can start tracking some upside for Gold.
Visit Market Trends to sign up for his newsletter and much more!
Monday, December 12, 2011
Is The Collapse in Gold Unavoidable?
Today, we want to take a close look at the gold market. We will see if the big move to the upside is over, and how far this move to the downside is likely to go. Plus, what investors should be doing right now in the gold market.
Get your favorite symbols' Trend Analysis TODAY!
Try MarketClub for 30 Days for just $8.95 - Click Here!
Get your favorite symbols' Trend Analysis TODAY!
Subscribe to:
Posts (Atom)