Showing posts with label rally. Show all posts

Thursday, September 20, 2018

How Bitcoin Will Make You Big Money Again

If you are a Bitcoin fan or looking for the next opportunity for a Bitcoin rally, you may not have long to wait before a price breakout takes place. Our research team at The Technical Traders believes a price breakout may occur before the end of 2018 – the only question is will it be a breakout rally or a breakdown crash before the next mega rally?

Cryptos and, in particular, Bitcoin has increased in popularity and adoption over the past 24 months across the globe. Recently, Citigroup has announced new technology making Crypto transactions more secure and reducing the risk of such transactions. Additionally, Circle recently announced a US Dollar based Crypto currency that is backed by Goldman-Sachs. News from Europe is that the EU has been urged to adopt common Crypto Currency rules that will fuel more attention and enterprise on developing suitable Crypto solutions for the European markets.

All of this plays into our research that a breakout/breakdown is inevitable and it is just a matter of time before this coiling price consolidation “apexes” and expands.

This chart shows massive breakdown washout below $6000 taking it back to prices before crypto became popular in early 2017.


This next chart below shows our cycle analysis and how much bitcoin moved from our cycle bottoms to tops. We are now at NEARING a critical juncture of a $6000 breakdown which is clearly a support level, and a potential major cycle bottom or continuation down cycle. Huge money can be made from this extreme volatility that is about to unfold and savvy technical traders can see the profit potential unfolding.


We urge all traders to keep Cryptos in focus over the next few weeks and months. Our research team shares our proprietary analysis and research with our paid members regarding the Crypto currency trends and trades.

If you want to learn what we believe will be the next big move in the Crypto markets, then visit The Technical Traders to learn more. Our proprietary modeling systems are clearly showing us what we should expect over the next few weeks and months. As a member, you will have access to this research and benefit from our Daily Research Videos.

Chris Vermeulen


Stock & ETF Trading Signals

Sunday, August 14, 2016

Why Corporate America Can’t Prop Up Stocks Much Longer

By Justin Spittler

Corporate America is bracing for tough times. Since you’re reading an investment newsletter, you likely own stocks. And if you’re like most investors, you keep up with how the companies you own are performing. You might even listen to quarterly “earnings calls,” which are when CEOs present results and give their outlook on the business.

Most of the time, CEOs act as cheerleaders on these calls. If business is bad, they’ll say business is good. If business is good, they’ll say it’s great. And CEOs are notoriously optimistic about the economy. After all, thousands of investors and analysts listen to these calls. CEOs know their stock can crash if they’re pessimistic about the business or economy. Because many CEOs will say anything to make their stock go up, we don’t put much stock in their words. We pay much more attention to their actions. And right now, large U.S. companies are acting like very tough economic times are ahead.

Business investment fell 2.2% last quarter..…
This metric measures how much companies spend on property, plant, and equipment. It was the third straight quarter that business investment fell. That hasn’t happened since the 2008-2009 financial crisis. We wouldn’t see this if the economy was headed in the right direction. Companies would be building more factories. They’d be buying more machinery. They’d be spending more money on research and development.

Instead, companies have cut back on investments. This tell us they don’t see many good opportunities. That’s a bad sign for the economy, yet stocks keep rallying. The S&P 500, Dow, and NASDAQ have all recently hit new record highs. At this point, you’re probably wondering what’s keeping stocks afloat if it’s not the economy.

Companies have spent about $2.5 trillion on “share buybacks” since the financial crisis..…
A buyback is when a company buys its own stock from shareholders. This can lift a company's stock price.
According to investment bank Goldman Sachs (GS), buybacks have been the biggest driver of U.S. stock performance since the financial crisis. Buybacks also reduce the number of shares that trade on the market.

This boosts a company’s earnings per share. But buybacks don’t make a company more profitable. They only make profits look bigger “on paper.” Companies have been buying up their own stock for two reasons: 1) They don’t see many growth opportunities. And 2) it’s incredibly cheap to borrow money.

The Federal Reserve has held its key interest rate near zero since 2008..…
The Fed cut rates to encourage households and businesses to borrow and spend more money. Mainstream economists thought this would “stimulate” the economy. It didn’t work. The U.S. economy has grown at an annualized rate of just 2.1% since 2009. This makes the current “recovery” the slowest by far since World War II.

The Fed did get folks to borrow huge sums of money. U.S. corporations have borrowed more than $10 billion in the bond market since 2007. Last year, they issued a record $1.5 trillion in bonds.
Buybacks are a big reason companies borrowed so much. MarketWatch reported last week:
Companies have been taking on piles of debt to finance buybacks, leading the total debt on the S&P 500 to grow 56% during the past five years.
According to Yahoo! Finance, companies in the S&P 500 funded 22% of last year’s buybacks with debt. This year, debt paid for 39% of share buybacks.

Corporate debt is now dangerously high..… 
According to Barron’s, corporate debt now equals 45.3% of gross domestic product (GDP). The only time this key ratio has ever been higher was in 2009, when it hit 45.4%. If the economy was doing well, this wouldn’t be such a big problem. Companies would be making enough money to pay their debts.

But right now, Corporate America is struggling to make money. Profits for companies in the S&P 500 are on track to fall for the fifth straight quarter. That hasn’t happened since the 2008-2009 financial crisis.
There’s no telling when this earnings drought will end either. According to research firm FactSet, analysts expect third quarter corporate profits to fall 1.7%. The third quarter ends on September 30.

Keep in mind, the U.S. economy is technically in a “recovery” right now. Imagine what will happen to corporate profits during the next recession. The more profits fall, the less money companies will have to prop up their shares with buybacks.
  
Companies have already started to cut back on buybacks..…
According to Business Insider, buybacks fell 18% last quarter. This sharp decline in buyback activity followed a near record breaking first quarter, in which companies in the S&P 500 spent an incredible $166 billion on buybacks. That’s the second most ever, and the most in one quarter since 2007. We don’t know exactly why companies are suddenly spending less on buybacks.

Maybe it’s because corporate profits are drying up. Maybe companies are starting to realize they have too much debt. Or maybe it’s because stocks are expensive. According to the popular CAPE ratio, stocks in the S&P 500 are 62% more expensive than their historic average. Since 1881, U.S. stocks have only been more expensive three times: before the Great Depression, during the dot-com bubble, and leading up to the 2008-2009 financial crisis.

Like any investment, buybacks only make sense when stocks are a good deal. With stocks as expensive as they are today, buybacks are a terrible use of money.

Without buybacks, there won’t be much to keep U.S. stocks from falling..…
If you own stocks, take a good look at your portfolio. We recommend that you get out of any company that needs buybacks to retain shareholders. We also encourage you to put 10% to 15% of your wealth in gold. As we often say, gold is real money. It’s preserved wealth for centuries because gold is unlike any other asset. It’s durable, easy to transport, and easily divisible.

Gold is also the ultimate safe haven asset. It’s survived economic depressions, stock market crashes, and full blown currency crises. When investors are nervous about stocks or the economy, they buy gold.
The price of gold has jumped 27% this year. It’s beat the S&P 500 4-to-1.

If you don’t already own gold for protection, we encourage you to do so immediately..…
According to Casey Research founder Doug Casey, the financial system is held together by “chewing gum and bailing wire” right now. When the public wakes up and realizes this, “they’ll flock to gold… just as they’ve done for centuries.” Doug thinks this could cause the price of gold to easily soar 200% in the coming years.

You could make 2x, 5x, or 10x that much money in gold stocks..…
Yesterday, we showed you how leverage works in the resource market. As we explained, this powerful force is why gold stocks can soar even if the price of gold doesn’t rise by that much. This year, gold’s 27% jump caused the VanEck Vectors Gold Miners ETF (GDX), which tracks large gold miners, to soar 128%.

Some folks might see that and think they missed their chance to buy gold stocks. But regular readers know gold stocks can go many times higher. During the 2000-2003 bull market, the average gold stock rose 602%. The best ones returned more than 1,000%. We expect even bigger gains in the coming years. To learn why, watch this short presentation. In it, Doug explains why we’re headed for “the biggest gold mania” he’s even seen.

By the end of this video, you’ll know why there’s never been a better time to own gold stocks. You’ll also learn how to make the most of this new gold bull market. We’re talking gains of 1,000%...2,000%...even 5,000%. Those kind of returns might sound impossible. But as you’ll see, Doug's hit many “home runs” like this throughout his career. And for the first time ever, he's showing the world exactly how he did this.

To learn Doug’s SECRET to making giant gains in gold stocks, watch this free video.

How Will Negative Interest Rates, the War on Cash, and “Helicopter Money” Affect the Markets?

Today, we have something special to share with you. Instead of the usual “Chart of the Day,” you’ll find a six-minute video presentation put together by our colleagues at Palm Beach Research Group.

In the video below, Palm Beach Research Group co-founder Tom Dyson and Palm Beach Letter editor Teeka Tiwari discuss how radical government policies are affecting global financial markets. As Tom and Teeka explain, these central bank “experiments” will have severe side effects. They could even push the price of gold to $5,000. To learn why, watch the video below.


If you like what you saw from Tom and Teeka, we encourage you to sign up for their “speed round” training series. Click here to get started.


Get out latest FREE eBooK "Understanding Options"....Just Click Here

Stock & ETF Trading Signals

Monday, October 27, 2014

Blood in the Streets to Create the Opportunity of the Decade

By Laurynas Vegys, Research Analyst

Gold stocks staged spring and summer rallies this year, but haven’t able to sustain the momentum. Many have sold off sharply in recent weeks, along with gold. That makes this a good time to examine the book value of gold equities; are they objectively cheap now, or not?

By way of reminder, a price to book value ratio (P/BV) shows the stock price in relation to the company’s book value, which is the theoretical value of a company’s assets minus liabilities. A stock is considered cheap when it’s trading at a historically low P/BV, and undervalued when it’s trading below book value.

From the perspective of an investor, low price to book multiples imply opportunity and a margin of safety from potential declines in price.

We analyzed the book values of all publicly traded primary gold producers with a market cap of $1 billion or more. The final list comprised 32 companies. We then charted book values from January 2, 2007 through last Thursday, October 15. Here’s what we found.


At the current 1.20 times book value, gold stocks aren’t as cheap as they were when we ran the numbers in June, 2013, successfully pinpointing the all-time low of 0.91 (the turning point before the period in gray). Of course, that P/BV is hard to beat: it was one of the lowest values ever. And while the stocks not quite as cheap now, the valuation multiple still lingers close to its historical bottom. Remember, we’re talking about senior mining companies here—producers with real assets and cash flow selling for close to their book values.

In short, yes, gold stocks are objectively selling cheaply.

The juniors, of course, have been hit harder. It’s hard to put a meaningful book value on many of these “burning matches” with little more than hopes and geologists’ dreams, but valuations on many are scraping the bottom, making them even better bargains, albeit substantially riskier ones.

What does this mean for us investors?

It’s no surprise to see that every contraction in the ratio was followed by a major rally. In other words, the cure for low prices is low prices:
  • The August, 2007 bottom (2.2) and the momentary downtrend that preceded it were quickly erased by a swift price rally leading to a January, 2008 peak (3.8).
  • The bull also made a comeback in 2009-2010, fighting its way up out of what seemed at the time to be the deepest hole (1.04) in October, 2008.
Stocks have been on a long slide since the ratio last peaked at 3.24 in October, 2010, with the downturn in 2013 pushing multiples to previously unseen lows.

No one—us included—has a crystal ball, and so it’s impossible to tell if the bottom is behind us. We can, however, gauge with certainty when an asset is cheap—and cash-generating companies selling for little more than book value are extraordinary values for big-picture investors.

Now let’s see how these valuations look against the S&P 500.


Stocks listed in the S&P500 are currently more than twice as expensive as the gold producers. That’s not surprising given how volatile metals prices can be and how unloved mining is—but is it rational? Note that despite the downtrend in the last month, the multiple for the S&P500 remains close to a multiyear high.

In other words, yes, the S&P 500 is expensive.

This contrast points to an obvious opportunity in our sector.

So is now the time to buy gold stocks? Answer: our stocks are good values now, and, if there is a larger correction ahead, they may well become fantastic values, briefly. Either way, value is value, on sale.

As the most successful resource speculators have repeatedly said: you have to be a contrarian in this sector to be successful, buying low and selling high, and that takes courage based on solid convictions. Yes, it’s possible that valuations could fall further. However:

The difference between prices and clear-cut value argue for going long and staying that way until multiples return to lofty levels again—which they’ve done every time, as the historical record shows.

With a long term time frame in mind, whatever happens in the short term is less of a concern. Building substantial positions at good prices in great companies in advance of what must transpire sooner or later is what successful speculation is all about. This is how Doug Casey, Rick Rule, and others have made their fortunes, and it’s why they’re buying in the market now, seeing market capitulation as one of the prime opportunities of the decade.

That’s worth remembering, especially during a downturn that has even die hard gold bugs giving up.
Bottom line: “Blood in the streets” isn't pretty, but it’s a good thing for those with the liquidity and courage to act.

What to buy? That’s what we cover in BIG GOLD. Thanks to our 3 month full money back guarantee, you have nothing to lose and the potential for gains that only a true contrarian can expect.


Get out latest FREE eBooK "Understanding Options"....Just Click Here


Saturday, June 21, 2014

WTI Crude Oil on the Move $112 Next Stop

The energy sector has surged during the last two months which can be seen by looking at the XLE Energy Select Sector Fund. If crude oil continues to climb to the $112 level, XLE will likely continue to rally for another few days or possibly week as energy stocks are considered a leveraged way to play energy price movements.

Another way to look at this info is through the USO United States Oil Fund. This tracks much closer to the price of oil. The only issue is that many ETFs that “try to track” an underlying commodity is in how the funds are built. They own multiple contracts further into the future which does not exactly provide us with the short term news/event driven price movements in the current front month contract as they should.

What does this mumbo jumbo mean? Well, it means funds like USO and the highly respected UNG, and VIX ETFs… (just joking about the highly respected part), fail to track the underlying commodity or index very well when it comes to short term price movements. This means, you can nail the timing of a trade, and the commodity or index will move in your favor, yet your fund loses money, or goes nowhere...

Let’s Focus on the Technicals Now….


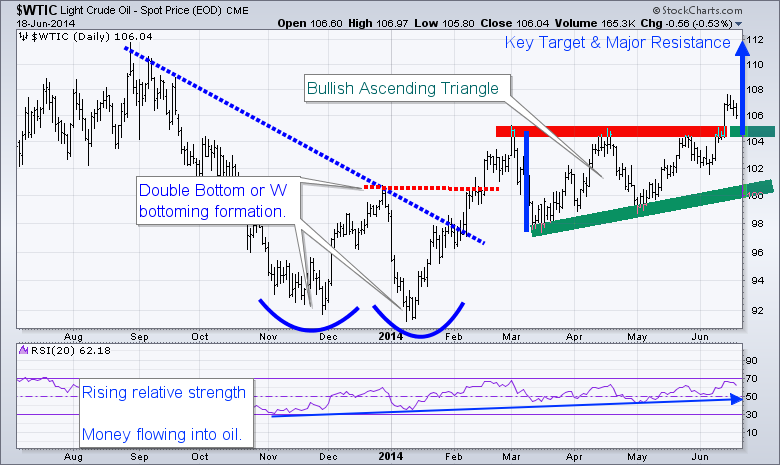
WTI crude oil has formed a bullish ascending triangle pattern from March to May of this year. The breakout to the upside is bullish and should be traded that way until the chart says otherwise. This breakout and first pullback must hold, or I will consider it a failed breakout. So if price dips and closes 2 days below the breakout level, it will be a major negative for oil in my opinion.

The range of the ascending triangle provides us with a measured move to the upside which is $112. Typically the first pullback after a breakout can be bought. The first short term target to scalp some gains would be $109, and at that point moving your stop to breakeven is a wise decision. Trading is all about managing capital and risk, if you don’t, then the market will take advantage of your lack in discipline.

Looking further back on the chart, you can see the double bottom formation also known as a “W” formation. Once the high of the “W” formation is broken the trend should be considered neural or up.

Also note that the RSI (relative strength) has been trending higher for some time now. This means money is rotating into this commodity. This is in line with my interview this week with Kerry Lutz and my recent article talking about the next bull market in commodities and the TSX (Toronto Stock Exchange).

clfutures


WTI Crude Oil Trading Conclusion:


In short, oil has some extra risk around it. The recent move has been partly fueled by news overseas. So at any time oil could get a lift or take a hit by news that hits the wires. I tent to trade news related events with much less capital than I normally do because of this risk.

Happy Trading,
Chris Vermeulen

WANT MORE TRADE IDEAS? GET THEM HERE: THE GOLD & OIL GUY.COM


Friday, August 30, 2013

Precious Metals & Miners Flash Short-Sell Signal

It has been a bumpy ride for precious metal investors over the past couple of years and unfortunately we do not think its over just yet. But we feel fortunate to have our trading partner Chris Vermeulen on our team walking us through this.

Today Chris is telling us that the good news is that the bottom has likely been put in for gold, silver and gold miners BUT the recent rally in these metals and miner looks to be coming to an end. While we could see another pop in price over the next week or so the price, volume and momentum seem to be stalling out.

What does this mean? It means we should expect short term weakness and lower prices over the next month or two.

Here are three charts Chris posted several months. Their forecast were based off simple technical analysis using cycles, Fibonacci and price patterns. As you can see we are not trading at our key pivot level which we expect selling pressure to start to increase and eventually overpower the buyers sending the prices lower.....Click here to see Chris' complete chart work and article.


Monday, August 12, 2013

The SP500 Enters Major Correction Period

Our trading partner David A. Banister of Market Trends Forecast releases his call that the SP 500 is close to confirming new correction. Says 1685 support is the key. Here's the details based on his Elliot Wave research.

The SP 500 has been on a tear since late 2012 with the SP 500 bottoming at 1266. The rally though we have been charting out as part of a “Primary wave 3″ uptrend for this Bull market cycle from March 2009, and we are likely entering a Major correction or what we would label “Major wave 4″. Since the 1266 lows, we have had Major Wave 1, 2, and now 3 completed at 1710. We are entering Major wave 4 which should correct 23-38% of the entirety of Major wave 3, which was 444 points.

This correction will be confirmed with any close below 1674 and nails in the coffin begin with any close below 1685 on the SP 500 index. Primary wave 1 of this super bull cycle ended at 1370, a 704 point rally. Primary wave 3 will likely be larger than Primary wave 1 and I am projecting a top between 1900-2000 on the SP 500 before it’s completed. The current correction is Major wave 4 of Primary wave 3, which has 5 Major waves required. With that said, our projections are for 1605 on the shallow side and 1540 on the deeper side for Major wave 4 of Primary wave 3.

Now it is possible that we may extend a bit higher yet in Major wave 3 to 1736-1772, but only if we hold the 1685 support lines which the market is basing around currently. In any event, at our Trading service we have been aggressively taking profits in the past two weeks on multiple positions while still holding a few open at this time.

Below is a chart showing our projected correction pivots of 1605 and 1540, subscribers will be updated on a regular basis. Just click here to join Banister with a 33% discount on his trading service and also receive Precious Metals (GOLD) forecasts on a regular basis every week.

812 SP 500


John Carter releases DVD version of "Spread Trading Strategies for any size Account"....Click Here to get your copy!


Sunday, April 7, 2013

The Long and Winding Gold....Bull Cycle about to Begin

The dramatic 2-3 day take down in Gold Spot pricing action smells and looks like capitulation to us at The Market Trend Forecast. We have been calling this entire 19-20 month consolidation period as a Primary wave 4 correction pattern, though complicated for sure. It has had multiple false rallies and buy and sell signals the entire time. With that said, the pattern is set up for final 5th wave decline which we are seeing now at the beginning of April.

Traditionally, Gold tends to meander or be weak in April anyways on a seasonal basis. This sets Gold up to rally in May into July with another soft patch, followed by a fall rally. However, our technical analysis is predicated on our Elliott Wave analysis, which says this entire 20 month correction is a “Double Three” correction pattern. Essentially its two ABC patterns with an “X” Wave rally in the middle to really confuse everyone.

The X wave took Gold to 1800 last fall before dumping all the Bulls off and eventually working its way down to the 1540’s levels we see today. This last leg down is a 5 wave decline and you know you’re at the bottom of wave 5 when everyone throws in the towel, the Gold stocks trade at multi year lows and relative valuation extremes. We also have insiders buying 7 to 1 over sellers according to Ink Research in the Gold stock sector. Stocks are valued at $923 per ounce equivalent even though Gold is trading north of $1,500 per ounce still.

We say bring it on and are actively accumulating selected Gold stocks with production profiles and growth metrics that are attractive.

See the Gold Elliott Wave analysis chart we sent to our paying subscribers a few days ago to forewarn of one more leg down. The next rally should be a doozy and have very few people on board. We would simply caution that a drop below $1523 spot pricing could lead to a blast down to the 1440-1460 areas, but its unlikely in our current views.

TMTFGold

Join us for regular updates at The Market Trends Forecast.com


How to Risk Less When You Trade

Wednesday, August 8, 2012

Do You Agree.... The SP 500 Nearing a Cyclical High

One of our favorite traders to follow is David Banister [make sure to sign up for his calls] and he just sent over this great post on his thoughts on the SP 500 nearing a cyclical high in the coming two weeks of trade. And here's what he is thinking.......

The SP 500 has rallied to a post June 4th high of 1409 this week, about 13 points shy of the Bull Market cycle highs of 1422 earlier this year.

The rally has overlapped along the way, forming a series of “3′s” which are sometimes found in impulsive bullish moves, but usually found at the end of bull cycles whether they be short term or long term cycles.

To wit, the first 11 trading days off the 1267 SP 500 lows saw a 97 point rally, again in only 11 trading days.

The last 34 trading days we have only been able to move up about 44 further points, indicating the rally is getting long in the tooth and a bit tired at that.

So 11 days, 97 points… 34 more days, only 44 further points.

Another 10 trading days would mark a 55 fibonacci trading day cycle, so we should be alert to potential rally highs between August 13th and August 22nd as a window for a top.

A few days ago I discussed we may see a continual sloppy drift up to 1425-1445 ranges, with 1434 a key pivot line to watch.

Although the count doesnt really fit for me, if this rally from the June lows is a 5th and final wave up… then a 5th wave rally to complete a larger cycle often is characterized by a series of 3′s.

To summarize:

The first leg of the rally was a 3 wave rally to 1363, about 97 points in 11 days. We have continued with overlapping 3′s. This final stage of the rally is likely going to be 5 waves or ABCDE in nature to complete the entire cycle up from 1267

That cycle high should come within the Aug 13th-22nd window and in the 1425-1445 ranges.


Make sure to visit Davids website to register for all of his articles

Test drive our video analysis and trade idea service for only $1.00

Thursday, May 3, 2012

Equities Fight to Hold Up While EU & US Data Give Mixed Signals

It’s Easy, get started trading options today. Let’s us show you how!

Investors and traders just can’t seem to catch a break when it comes to economic news. For example Tuesday in the United States we saw strong ISM manufacturing numbers which surprised the market. The numbers were way above expectations and it triggered a feeding frenzy in US based investments like stocks and the green back.

The following session Italy reported terrible PMI and unemployment rate numbers which took most of the wind out the European and US stocks. One day the data is great, next day it’s bad…

The strong numbers in the US have everyone including myself thinking that this week’s jobless claims (unemployment rate) will be down. If this is the case then we will see stocks jump along with the dollar, much like what we saw trader do last Tuesday which is what Jim Cramer says best – BUY BUY BUY.

Normally we do not see the dollar index rally along with stocks but if EU continues to show signs of weakness then it is very likely the dollar and equities inverse relationship could decouple. Reason being investors around the globe will focus their money on the more stable US investments like the dollar and US stocks.

The Dollar is Trading at a Major Tipping Point....Read the entire article.

Get Instant Access to our FREE E-mini Trading Video, LIVE Personal Training and more TODAY!

Sunday, November 13, 2011

Has The SP 500 Index Been Naughty or Nice?

At the beginning of this week I warned readers that the market was extremely overbought and that a top could be forming. While it is still unclear whether a major top has formed, it is without question that we saw a major correction on Wednesday as yields on Italian debt caused margin requirement adjustments at the London Clearing House.

I generally will not make bold predictions as today’s financial markets are so dynamic that a lot can change in a short period of time. However, Tuesday night I sent out a video to members of my service which I entitled my “European Rant.” My soapbox rant discussed where we were in the market and what my thoughts were regarding the structural issues in Europe.

Little did I know that the very next day Italian 10 year bond yields would surge calling the fiscal stability of the Eurozone back into question. My intent for the video was to give my members a better understanding of what was going on in Europe. As it turned out, the video was spot on in its timing so I could not help but share it with readers.

My current view on the S&P 500 is neutral. I am watching several key price levels on the S&P 500 Index for clarity, but so far Mr. Market has not tipped his hand. I am watching for a breakout over recent highs around the 1,290 area before I consider layering back into long positions. Consequently, I am watching the 1,230 and 1,190 areas as potential short entry points. The daily chart of the S&P 500 Index is shown below:

SPX Option Support Levels

Clearly the 1,190 – 1,200 level should offer strong support as the 50 period moving average is resting right at the 1,200 price level currently. If the 1,190 price level breaks down I think we could see a dramatic selloff transpire. On the flip side, if the recent highs around 1,290 are taken out to the upside we could see a rally that takes us back to the 2011 highs around 1,370. Right now I am going to wait patiently and let others do the heavy lifting.

The 1,257 price level on the S&P 500 Index is a major pivot that I am going to be watching closely. If the bulls can push prices above that area for two or more consecutive closes I think the bulls may have the bears on the ropes. As of the writing of this article, the SPX is currently trading around the 1,263 level. If the bulls can hold up prices into the closing bell, we could see an extension higher on Monday. The chart of SPX below illustrates the key 1,257 price level:

SPY Option Trading Setup

At the close on Tuesday I was involved in a SPY 122 Put Calendar Spread for members which capitalized on time decay (Theta) as well as lower prices in the SPY ETF. Thursday morning I took profits on the position locking in a gain of around 13% on maximum risk. Recently I have had several winning trades for members of my service, but I admittedly have been taking profits aggressively and trading in smaller size due to the wild volatility swings that are commonplace in this market.

Trading is a marathon, not a sprint and my focus is to live to play another day. Since the inception of my service, I am running at about a 70% success rate based on all trades that have been taken. I am not telling you this to boast, I am telling you this to point out that I am wrong 30% of the time. In the trading world the overall numbers look good, but if my position sizing is not appropriate the 30% could potentially blow up my account.

With that in the back of my crowded mind, I try to use smaller position sizes and lock in profits aggressively during times of widespread volatility. I take fewer trades and focus my attention on risk and money management during times of heightened volatility which has been prevalent the past few weeks.

In addition to monitoring my risk profile, I am watching the price action in two underlying assets which I believe will throw off clues about where this market may be headed. The EUR/USD currency pair has been on my screens quite a bit the past few weeks. Most of the time I monitor the U.S. Dollar Index futures as well, but recently my focus has been on the currency pair. The chart below illustrates the correlation between the Euro currency and the S&P 500 since September:

Euro Index Trading
Euro Index Trading

Since the beginning of September, the moves in the S&P 500 have been very similarly correlated to the Euro currency as can be seen above. Additionally the Dow Jones Industrial Average also has very similar congruence in terms of price action when compared to the Euro.

The strength of the Euro has a profound impact on the price action of the U.S. Dollar Index. The U.S. Dollar Index soared on Wednesday and took out recent resistance. Since Wednesday, the Dollar has been retracing a large portion of the move higher. The daily chart of the Dollar Index is shown below:

USD Dollar Index Trading

It is a bit too early to tell for sure, but the Dollar could be rolling over based on austerity plans coming out of Italy and the expectation that the Eurozone is going to try to get ahead of the crisis unfolding based on the yields of Italian government debt instruments.

Last and certainly not least is the banking sector of the economy. The KBW Banking Index (BKX) is a proxy for financial institutions domestically. The KBW Banking Index is a great indicator for the future price action in the S&P 500. Stocks cannot rally if the banks do not participate with higher prices.

If stocks are selling off and the financials are holding up well many times equity indices will reverse higher. The key price level that a lot of traders are monitoring currently is the 40 area. The daily chart of the KBW Banking Index is shown below:

Banking Index XLF, FAS Trading

Similar to the key 1,257 pivot level on the S&P 500 Index, the key 40 price level on the KBW Banking Index has a similar impact on the underlying price action. If the bulls can push the BKX above the 40 price level and hold it up then a rally in stocks becomes more likely. As I write this, the BKX is trading at $39.78 / share so we are getting close to crunch time. The S&P 500 has broken above its pivot during intraday trade and now a lot of eyes are watching to see if the banks can follow through.

Ultimately investors could be looking at a Santa Claus rally or an absolutely ugly selloff in the near future. I will be monitoring the key price levels mentioned above on the S&P 500 and will wait patiently for Mr. Market to tip his hand. This is a tough market to trade and volatility is running relatively high. Headline risk coming out of Europe is seemingly constant. I would keep position sizes light and monitor risk aggressively. This is not the time to be a hero!

Subscribers of OTS have pocketed some serious return in the past few months. If you’d like to stay ahead of the market using My Low Risk Option Strategies and Trades check out OTS at Options Trading Signals.com and take advantage of my professional trading alerts and position management experience each week.

JW Jones

Thursday, October 21, 2010

What is Next for the Dollar, SP500 and Gold

The equities market reversed to the upside Wednesday posting a light volume broad based rally. Remember light volume tends to have a neutral to upward bias on stocks, But it was mainly the sharp drop in the dollar which spurred stocks and commodities higher.

Today’s bounce was not much of a surprise for several reasons…
• Overall trend is up, one day sell offs are generally profit taking
• Panic selling on the NYSE tipped us off that the market was oversold
• I don’t think they will let the market fall before the November election
• Intermediate cycle is turning up this week, 3 weeks of upward momentum…

US Dollar Index – 4 Hour Chart
The dollar put in a big bounce this week filling its gap window… Remember most gaps get filled with virtually every investment vehicle so when you see them remember this chart....


SPY ETF – Daily Chart
SP500 has been riding the key moving average up and Tuesday’s sell off tagged the 14MA along with extreme market internal readings telling intraday traders that a bounce is about to take place.


Gold Futures – Daily Chart
You can see gold has done much the same… A sharp profit/stop running sell off, which took the price back down to support. We took a long position to catch this bounce and hopefully a larger move going forward.


Market Sentiment Readings
Tuesday’s pullback was a great reminder of just how over extended the equities market was. These heavy volume sell offs are typical in a bull market. Without regular pauses in price, traders tend to place trailing stops moving them up each day. With traders chasing stocks higher bidding them up instead of waiting for a pullback we get a very large number to stop orders following the price up each day. Then, it’s only a matter of time before a key short term support level is broken at which point the flood gates open and everyone’s stops turn to market orders flooding the stock exchanges with sell orders causing a rapid decline and panic selling. This is exactly what happened on Tuesday which I show in the chart below.

Understanding how to read market internals provides great insight for short term traders looking to make quick high probability trades every week… Market internals are just part of the equation but very powerful on their own with proper money/position management. Both of these intraday extremes were bought on Tuesday in the advanced chatroom (FuturesTradingSignals.com).. We quickly booked profits and moved our stops up in order to protect our capital as the market surged higher.


Mid-Week Market Trend Analysis:
In short, the US Dollar is still in a down trend overall. The Fed’s I would think will continue to hold the market up into the election. It works well for them… they print money which devalues the dollar, and in return boosts stocks and commodities, plus they get trillions of dollars to spend… I’m sure its like kids in a candy store over there.

While everyone is trying to pick a top in this over extended market I think it is crucial to stick with the overall trend and to not fight the Fed. Using the key moving averages on the daily chart as shown in the charts above, continue to buy on dips until the market closes below the 20 day moving average at which point you should abandon ship.

Get My Reports and Trade Ideas Here for Free at The Gold and Oil Guy

Chris Vermeulen


Share

Tuesday, November 11, 2008

Forget The Experts, Trade The Trends And Sleep Good


I know, you hear it every day on the "alphabet" TV channels. These are tough times, what are you to do? Your portfolio is in the brink!

What you do is change your mind set. Stop investing, at least for now. And what I mean by that you should stop listening to the "experts" and become a trader. A trader who relies on trends. And believe me you can do this and sleep good at night.

My life as a trader changed upon meeting Adam Hewison and the guys at Market Club and INO.Com. Adam has a simple system for following the trends that has changed my life. The Market Club subscription is worth every penny, but Adam will let you sign up for a free account that will notify you daily of the trend of all of the stocks you include in your free account.

Here is a small example of what it looks like.....

Early this week the Chinese government announced a "Stimulus Package" that caused all of the commodities and especially the metals to pop. Let's say you have a position in Freeport McMoran, ticker FCX, and you are thinking "do I sell this rally, or back up the truck because it's off to the races"? Let's look at the chart from my free portfolio that was emailed to me.....

-----------------------------------------------------------------------------------

FREEPORT-MCMORAN COPPER & GOLD (NYSE:FCX) Strong Downtrend Up Arrow

Smart Scan Chart Analysis confirms that a strong downtrend is in place and that the market remains negative longer term. Strong Downtrend with money management stops. A triangle indicates the presence of a very strong trend that is being driven by strong forces and insiders.

Based on a pre-defined weighted trend formula for chart analysis, FCX scored -100 on a scale from -100 (strong downtrend) to +100 (strong uptrend):

-10 Last Hour Close Below 5 hour Moving Average
-15 New 3 Day Low on Tuesday
-20 Last Price Below 20 Day Moving Average
-25 New 3 Week Low, Week Ending October 25th
-30 New 3 Month Low in October
-100 Total Score


-----------------------------------------------------------------------------------

I quick look at the chart makes this a simple call to sell FCX on the rally caused by the catalyst created by the Chinese announcement. It is not even close, Freeport McMoran is trending down. And wouldn't you know it, FCX lost 10% right out of the gate this morning.

If you subscribe to the Market Club you will also be supplied your buy and sell signals with the Triangle Trading method. Again, worth every penny.

So forget what the experts are telling you and trade the trends. Take your life back and make money in any market.

Get your FREE favorite symbols' Trend Analysis TODAY! Click Here

Wednesday, October 29, 2008

Guest Blogger Larry Levin "Turnaround Tuesday & Government Lies"


Guest Blogger today is Larry Levin. Larry is very passionate about the the government actions during this bear market. I look forward to Larry's newsletter everyday and you can sign up for it here Larry Levin's Newsletter

The market rallied Tuesday - big time. On average, all three of the major indices posted +10% gains. What was the good news you wonder? Well, ummm, there was the - no. Umm, it was - no wait, I can't remember. Oh yeah, it was actually the good news of, umm, nothing actually. Today was a lack-of-selling-rally. The market could not break the recent lows for days on end, and as soon as some of the sellers covered - BOOM - short covering rally. Today's pop was accompanied by anemic volume so I wouldn't trust it longer than a few days. Will turnaround Tuesday be followed by turnaround Wednesday or Thursday?

The answer could come via the FOMC tomorrow. Wall Street (what's left of it) has demanded another interest rate cut so you can bet it's a done deal. Although nothing the Fed has done has "worked," the Street still wants a quick fix.

Will cutting rates right by 50-basis points do anything? I have my doubts since the effective federal funds rate has already fallen to 1% due to a new Fed policy to pay banks interest on the excess reserves they deposit at the Fed. The very point of paying that interest was to reduce the effective rate, so a cut tomorrow is just for show.

Have you seen ANY trickle down of lower rates yet? I sure haven't. Not long ago the Fed Funds rate was 5.75%, and tomorrow it will surely be 1%. The regular Joe sees little benefit from lower rates. Banks just are not passing along the lower rates to consumers in the form of lower interest rates on loans or credit cards. Banks are like roach motels. The nearly free money from the FOMC goes in, but doesn't come out! The savers and responsible people of this country are being fleeced to support all of the deadbeat banks and tapped out borrowers. After inflation (which is still out there - just not as bad as before), savers get a negative rate of return. It seems like there is no place left to flee in this world responsibility matters.

Perhaps tomorrow's cut is the next step in following the Bank of Japan (BOJ)? When Japan suffered its deflationary spiral after its housing bubble, the BOJ cut rates to ?-of-1%. A few months ago it raised rates to ?-of 1%, and is now considering cutting rates to ?-of-1% soon. Maybe, just maybe, if Helicopter-Ben cuts rates to ?-of-1% your credit card interest rate will be cut to 20% or so. In fact, an ex-Fed Governor is recommending ZERO Fed Funds rate for 2009!

Wake up folks, the Fed doesn't give a damn about you, if you get a lower rate on anything; it only cares if their banking buddies are solvent.

Moreover, Fed chairman Bernanke has shown he doesn't care if he follows the Constitution or not. He just declares exigent circumstances, which is his get-out-of-jail-free card. In the I Can Do Whatever I Want file in Bernanke's cabinet we see he is now backstopping foreign governments. Yeah, you read that right: YOUR TAXDOLLARS ARE DIRECTLY BAILING OUT FOREIGN BANKS! Oct. 28 (Bloomberg) -- State-run Korea Development Bank received Federal Reserve approval to sell as much as $830 million of commercial paper to the U.S. central bank, becoming the first Korean bank to tap the new funding facility. Kookmin Bank, South Korea's largest, was also deemed eligible to sell commercial paper to the Fed.

Now we're buying foreign commercial paper issued by a foreign bank controlled by a sovereign nation. Great. Amazing. WTF! Did you get to vote on this? Are you pissed off YET? If not, what is it going to take? Is this constitutional? Ah, who cares says Bernanke - exigent circumstances! But for whom I wonder? The Koreans? Since when is that our business?

Excuse me, but isn't this Congresses territory? I seem to recall that when the US hands out aid it must be voted on by those who have been elected. Furthermore, Congress decides how the money can be spent. Now Bernanke of the Fed is taking over - exigent circumstances he says.

I think Bernanke should be shackled and thrown in jail. Under what charge, he asks? Exigent circumstances comes the reply!

Mr. Bernanke was never granted this power, but as I have mentioned he doesn't care. It's a form of lying, lying by omission. The $700-billion TARP handout to Wall Street banks was supposed to be lent out to the average guy, at a low rate to boot. After all, the Fed keeps cutting rates - right? However, no money is being lent out. Wall Street banks are using YOUR TAXDOLLARS to pay an estimated $70-billion in bonuses this year. WHAT!??? Bonuses? For what - bankrupting the world economy? They are using YOUR TAXDOLLARS to pay dividends to shareholders. Why cut the dividend when the government is handing out money? They are also using YOUR TAXDOLLARS to acquire other banks. Whatever is left over is being hoarded.

It was another lie folks. You were bamboozled again. Hank Paulson NEVER said this was part of the deal! Hank Paulson, who is now literally being called King Paulson on Wall Street and in D.C., said the $700-billion would be used to buy bad assets? Puhhhlleeaaaseeeee!!! SUCKER!!! I begged you to call your Congressman to stop this. The only thing that is left is to vote against everyone who approved this steaming pile of dung on Nov. 4th.

Are there any more lies out there you wonder? Hmm, let's look under this rock. Ah yes, here's another lie from the government to expose. Congress recently approved a handout of $25-billion for the Big 3 automakers, which are to help speed the availability of fuel-saving technologies - period. But who cares anymore? Apparently nobody.

The White House is working to release $5-billion of that $25-billion immediately for the purpose of GM merging with a private company, Chrysler. According to the Wall Street journal, however, this is only half of what will be needed. The combined entity would need about $10 billion in new equity to cover the cost of laying off workers, closing plants and integrating the two companies, say people involved in the talks.

So I guess that means the merger money, that you were never told you had to pay, is only half way there. You were lied to AGAIN!

Automakers gained on the news of the taxpayer's fleecing. At today's closing price you can get a lunch at your favorite fast food restaurant for one share of GM. It might take two or three shares of Ford for one of those meals. The answer, however, all depends on your McFatty McFat level of consumption. Super size what - my lunch or the deficit? And yes, I'll take a side of deflation, why not.

In today's only economic news, the Conference Board reported its consumer confidence index fell to a record low in October. In fact, it was the largest one-month decline in the index - EVER! As bad as consumers think the economy is now, they are convinced it'll get worse. Consumers say their job prospects are weak, their incomes aren't likely to grow, and the prices they pay are likely to soar.

Unfortunately the story ends there. I was hoping to read WHERE and WHEN the masses would assemble to march on DC, with pitchforks and torches in hand of course, because I'll lead the march. I've had it up to here with all of the Fed's, Treasury's, White House's, and Congresses bu!!sh*t.

Trade well and follow the trend, not the so-called experts.

Sign Up For Larry Levin's Daily Newsletter

Thursday, October 23, 2008

Paulson's Bazooka, Out Of Ammo


After weeks, well months of government "cures" for the market and the economy, we are pretty much right where we are started. The one thing that has done the American public any good is the "gas relief bill" that we wrote ourselves. Most of Washington is on vacation and obviously in no hurry to make any changes. They were sure in a hurry to put a lien on our grand childrens future before they took their fall recess.

Just get use to this market, it will be this way for some time. After more than a month of runs on the hedge funds just wait until retail customers get their statements for October, the runs on the Mutual Funds are just getting started.

I don't want to be negative but you have to be honest with yourself. I get emails from investors and traders everyday whose one thought is like that of a small child. Can we go now? Is It Safe to go in now? I admire Warren Buffett so much. But I thought he did the public such a dis-service writing in a major newspaper that "It's Time To Buy". Mr. Buffett joining the market cheerleaders is just wrong.

Am I saying "Go Short Young Man". I am not suggesting that to anyone that does not already have a short plan in place. But of course I will be shorting this market on every rally since that is where the trend is taking us. Especially the NASDAQ. The long term investors that are starting to buy are after large cap companies with great dividends and a great history of paying them. And the NASDAQ has very few of those.

Be careful at there, and don't poke your head out. You know what might happen!