Nobody better in the industry at understanding herd mentality then the staff at The Technical Traders. And of course they have been telling us it would be like this.....you just have to know which herd to watch and when.....
For the past several weeks, everywhere I looked all I could find was bullish articles. After the fiscal cliff was patched at the last second, prices surged into the 2013 and have since climbed higher all the way into late February.
I warned members of my service that this runaway move to the upside which was characterized by a slow grinding move higher on excessively low volume and low volatility would eventually end violently. I do not have a crystal ball, this is just based on my experience as a trader over the years.
Unfortunately when markets run higher for a long period of time and just keep grinding shorts what typically follows is a violent selloff. I warned members that when the selloff showed up, it was likely that weeks of positive returns would be destroyed in a matter of days.
The price action in the S&P 500 Index since February 20th has erased most of the gains that were created in the entire month of February already and lower prices are possible, if not likely. However, there are opportunities to learn from this recent price action.
There were several warning signs over the past few weeks that were indicating that a risk-off type of environment was around the corner. As a trader, I am constantly monitoring the price action in a variety of futures contracts in equities, currencies, metals, energy, and agriculture to name a few.
Besides looking for trading opportunities, it is important to monitor the price action in commodities even if you only trade equities. In many cases, commodity volatility will occur immediately prior to equity volatility. Ultimately the recent rally was no different.
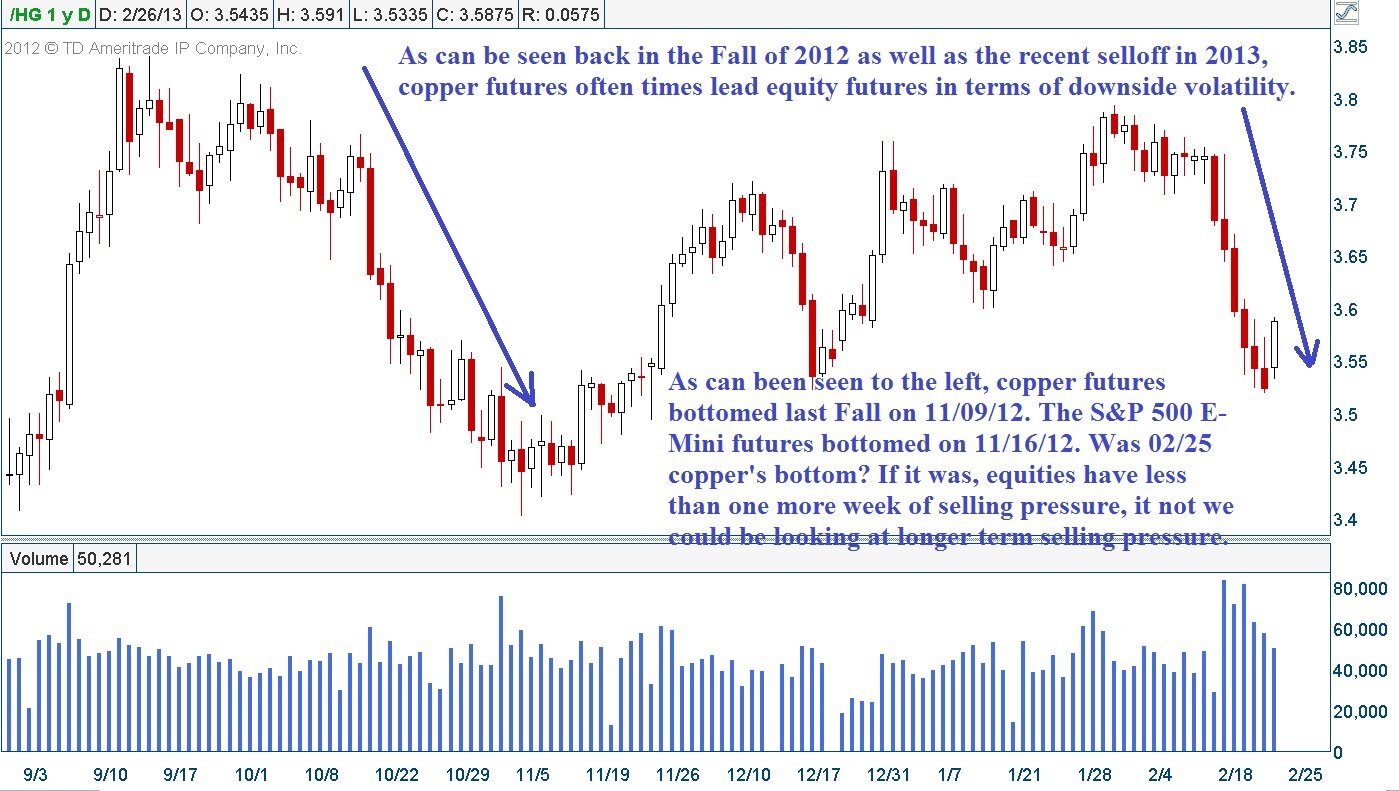
As an example, metals were showing major weakness overall with both gold and silver selling off violently. However, what caught my eye even further was the dramatic selloff in copper futures which is shown below.
Copper Futures Daily Chart

As can be seen above, copper futures had rallied along with equities since the lows back in November. However, prices peaked in copper at the beginning of February and a move lower from 3.7845 on 02/04 down to recent lows around 3.5195 on 02/25 resulted in roughly a 7% decline in copper prices over a 3 week period.
As stated above, commodity volatility often precedes equity volatility. As can be seen above, copper futures appear to be reversing during the action today and many times commodities will bottom ahead of equities.
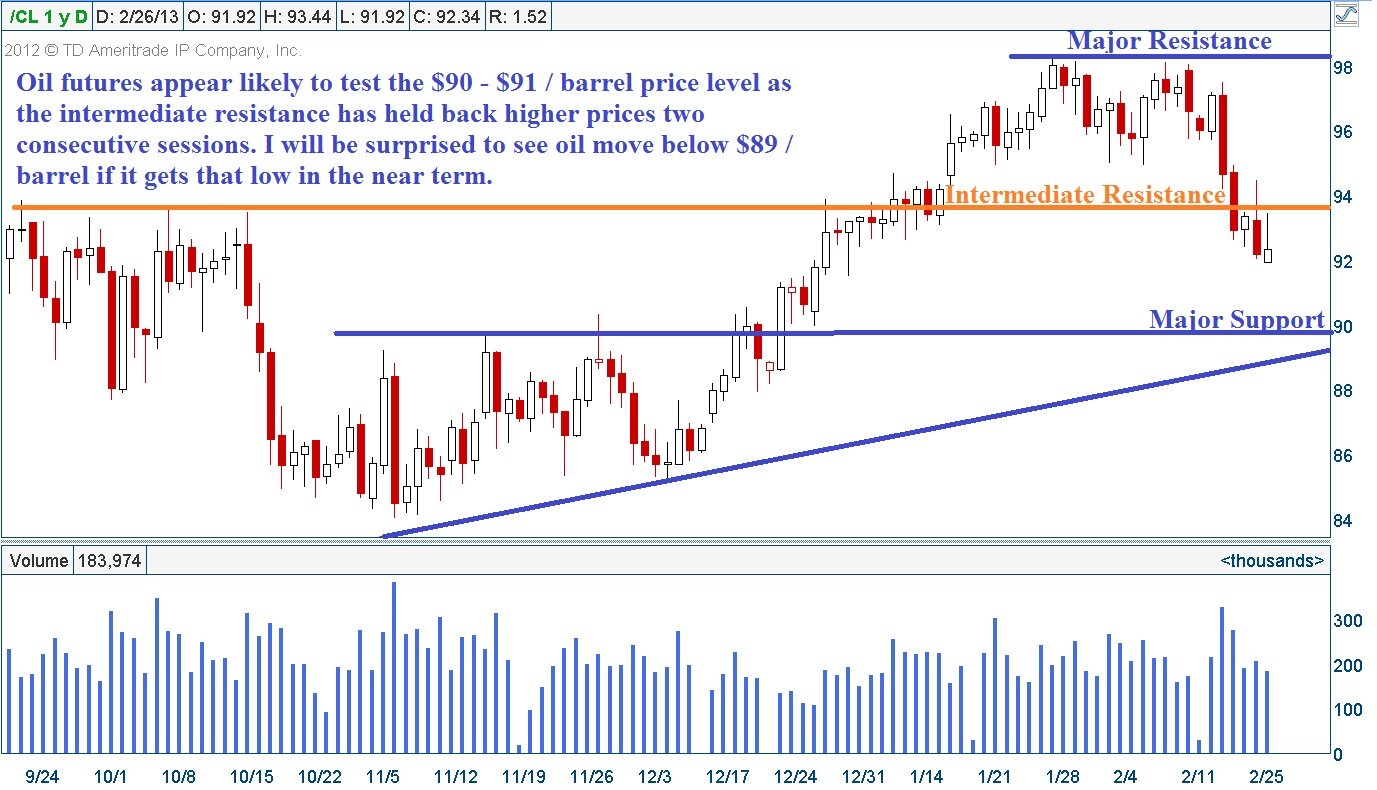
I want to be clear in stating that equities will not necessarily mirror the action in commodities or copper specifically, but some major volatility was seen in several commodity contracts besides just metals. Oil futures were also coming under selling pressure as well.
Crude Oil Futures Daily Chart

As can be seen above, oil futures topped right at the end of January and then sold off briefly only to selloff sharply lower a few weeks later. Oil futures gave back roughly 6% – 7% as well which is quite similar to copper’s recent correction. I have simply highlighted some key support / resistance levels on the oil futures chart for future reference and for possible price targets.
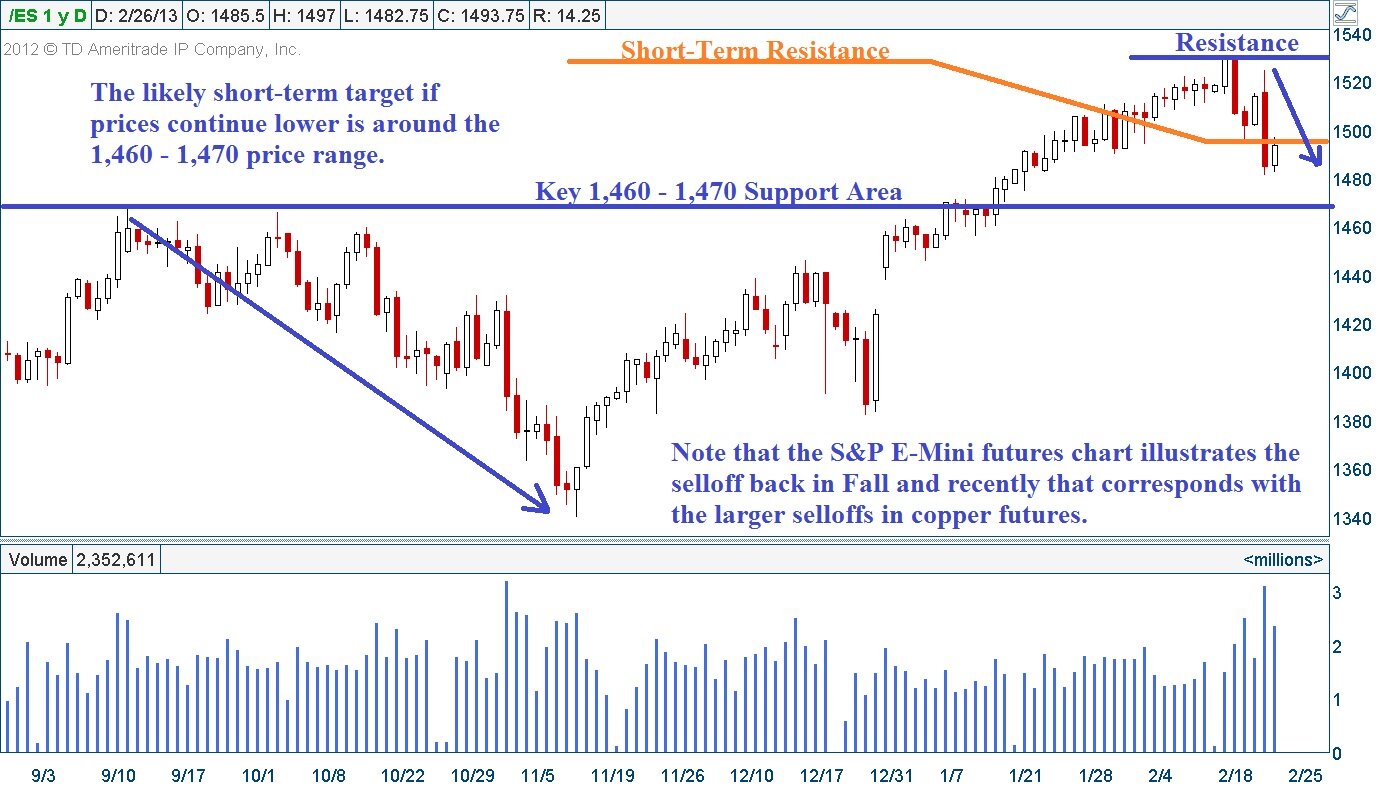
In equity terms, since February 20th the S&P 500 futures have sold off from a high of around 1,529 to Monday’s low of 1481.75. Thus far we are seeing a move lower of about 3.10% since 02/20 in the S&P 500 E-Mini futures contract. While I am not calling for perfect correlation with commodities, I do believe that a 5% correction here not only makes sense, but actually would be healthy for equities.
S&P 500 E-Mini Futures Daily Chart

If we assume the S&P 500 E-Mini contracts were to lose 5% from their recent highs, the price that would correspond with that type of move would be around 1,453.
As shown above, while 1,453 does represent a consolidation zone in the S&P 500 which occurred in the beginning of January of 2013, there is a major support level that corresponds with the 1,460 – 1,470 price range.
I am expecting to see the S&P 500 test the 1,460 – 1,470 price range in the futures contract, however the outcome at that support level will be important for future price action. If that level holds, I think we likely reverse and move higher and we could even take out recent highs potentially. In contrast, if we see a major breakdown below 1,460 I believe things could get interesting quickly for the bears.
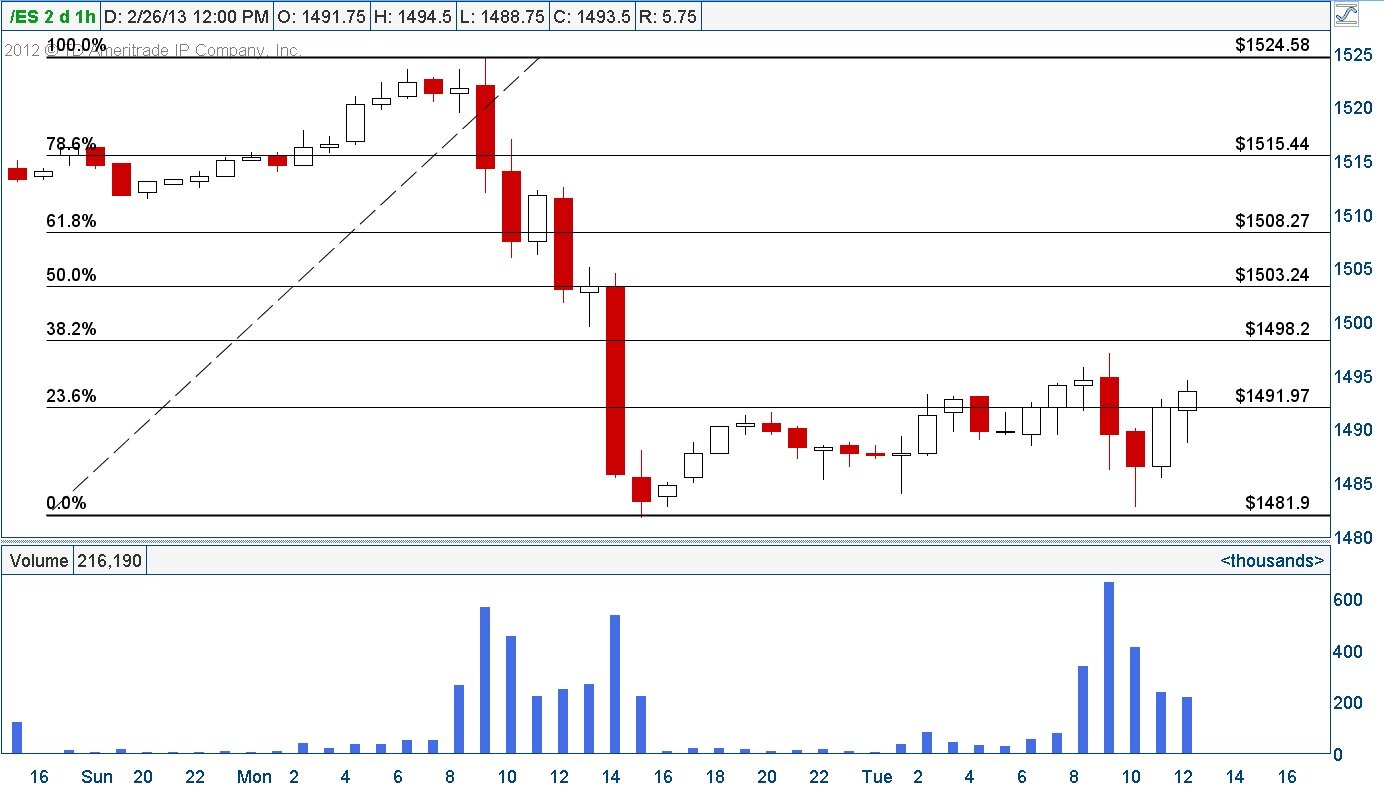
I am watching the price action today closely as I am interested in what kind of retracement we will get based on yesterday’s large bullish engulfing candlestick on the daily chart of the S&P 500 futures.
Ultimately if the retracement remains below the .500 Fibonacci Retracement area into the bell we could see some stronger selling pressure setting in later this week. The Fibonacci retracement of the 02/25 candlestick can be seen below.
S&P 500 E-Mini Futures Hourly Chart

So far today we have not been able to crack the 0.382 Fibonacci retracement area. This is generally considered a relatively weak retracement and can precede a strong reversal which in this case would be to the downside in coming days.
It is always possible to see strength on Wednesday and a move up to the .500 retracement level. As long as price stays under the .500 Fibonacci retracement level, I think the bears will remain in control in the short-term. However, should we see the highs from 02/25 taken out in the near term the bulls will be in complete control again.
Right now I think it is early to be getting long unless a trader is looking to scale in on the way down. I think the more logical price level to watch carefully is down around 1,460 – 1,470 on the S&P 500. If that level is tested, the resulting price action will be critical in shaping the intermediate and long-term price action in the broad equity indexes.
If you have to trade, keep position sizes small and define your risk. Risk is elevated at this time.
If you would like to get our detailed trading videos each week and know what is just around the corner test out here:
Risk FREE 30 Day Trial only $1 for the first 30 days!
Chris Vermeulen & JW Jones
The "Traders Video Playbook"
Get our Free Trading Videos, Lessons and eBook today!