Showing posts with label consolidation. Show all posts

Monday, July 7, 2014

Gold Option Trade – Will Gold Continue to Consolidate?

Until recently, the world has forgotten about gold and gold futures prices it would seem. A few years ago, all we heard about was gold and silver futures making new highs on the back of the Federal Reserve’s constant money printing schemes.

However, after a dramatic sell off the world of precious metals it became very quiet.


Gold prices have been in a giant basing or consolidation pattern for more than one year. As can clearly be seen below, gold futures prices have traded in a range between roughly 1,175 and 1,430 since June of 2013.


Chart1


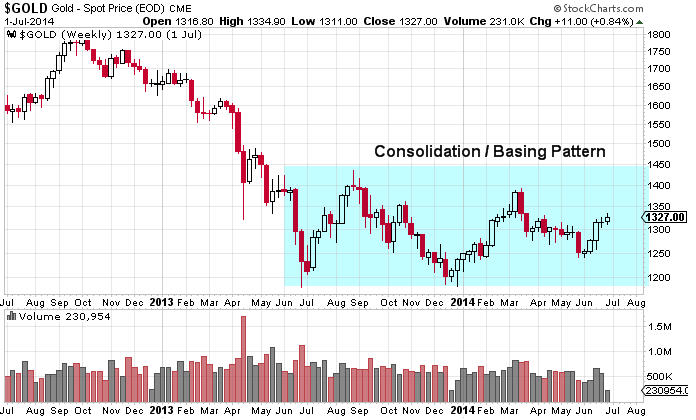
The past few weeks we have heard more about gold prices as we have seen a five week rally since late May. I would also draw your attention to the fact that gold futures also made a slightly higher low which is typically a bullish signal.


At this point in time, it appears quite likely that a possible test of the upper end of the channel is possible in the next few weeks / months. If price can push above 1,430 on the spot gold futures price a breakout could transpire that could see $150 or more added to the spot gold price.


Clearly there are a variety of ways that a trader could consider higher prices in gold futures. However, a basic option strategy can pay handsome rewards that will profit from a continued consolidation. The trade strategy is profitable as long as price stays within a range for a specified period of time. Ultimately this type of trade strategy involves the use of options and capitalizes on the passage of time.


The strategy is called an Iron Condor Strategy, however in order to make this trade worth while we would consider widening out the strikes to increase our profitability while simultaneously increasing our overall risk per spread. Consider the chart of GLD below which has highlighted the price range that would be profitable to the August monthly option expiration on August 15th.


Chart2


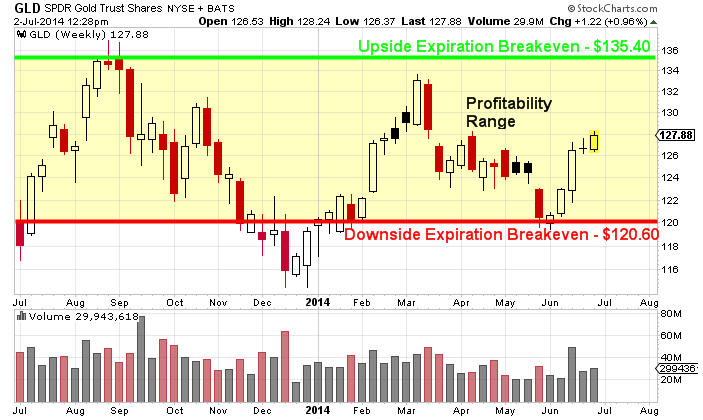
As long as price stays in the range shown above, the GLD August Iron Condor Spread would be profitable. Clearly this strategy involves patience and the expectation that gold prices will continue to consolidate. This trade has the profit potential of $37 per spread, or a total potential return based on maximum possible risk of 13.62%. The probability based on today's implied volatility in GLD options for this spread to be profitable at expiration (August 15) is roughly 80%.


Our new option service specializes in identifying these types of consolidation setups and helps investors capitalize on consolidating chart patterns, volatility collapse, and profiting from the passage of time. And if you Advanced options trades are not your thing, we also provide Simple options where we buy either a call or put option based on the SP500 and VIX. The nice thing about buying calls and puts is that you can trade with an account as little as $2,500.


If You Want Daily Options Trades, Join the Technical Traders Options Alerts

See you in the markets!

Chris Vermeulen

Sign up for our next free trading webinar "Low VIX and What It Means to Your Trading"


Thursday, September 22, 2011

David Banister: Gold Continues to Correct as Forecast in a 4th Wave Pattern


I got a bit of hate email over the last few weeks from the Gold Bugs who thought I didn’t know what I was talking about when I forecasted a multi-month consolidation and correction in Gold was imminent. I’ve written ad nauseum about crowd behavioral patterns as they related to both stock markets and precious metals. 

It should not come as a surprise that Gold is continuing to drop after a 34 Fibonacci month rally from $681 to $1910 per ounce. That rally came in five clear Elliott Waves and ended with a parabolic race to the top. I consistently warned my subscribers and readers of my articles about not being caught holding the bag and to take defensive measures.

My most recent update was to simply try to figure out whether the continuing correction in Gold would take the form of an ABC pattern or an ABCDE Triangle Pattern. It is becoming more clear that the official pattern is ABC. In English it means that the first leg down from 1910 to 1702 was the “A” Wave, the rally back up to 1920 was the “B” wave. 

The C wave is continuing underway and one of my longstanding targets is $1643, which is a Fibonacci fractal relationship to the prior lows and highs, and also conveniently fills in a “Gap” in the Gold chart in the 1650’s.

During these 4th wave consolidation periods, it reduces sentiment back down to normal levels and lets the economics of the move in Gold catch up with the price action that was extended. The first area to watch is the retest of $1702 spot pricing for a C wave low, but the evidence is for a further drop to $1643 before I would get too interested in trying to game Gold to the upside.

Here is the chart I sent out 9 days ago with Gold at $1837 forecasting a possible C wave continuing lower:

I’ve stayed away from either shorting Gold or going long gold while I watch and confirm the 4th wave pattern. It’s simply the smart way to go knowing that upside will be difficult to obtain and downside risks are high. It does now appear that I am eliminating the Triangle pattern and sticking with the ABC Correction with the C wave still working its way lower. If $1702 breaks, then you should expect to see 1620-1643 as next pivot low ranges.


If you’d like to stay ahead of the SP 500, Silver, and Gold trends, check out TMTF at Market Trend Forecast.Com and take advantage of our free occasional reports or a 33% 48 hour coupon to sign up for 5-7 updates a week.

Sunday, September 18, 2011

You Heard it Here First....Gold Heading to $2,350 Per Ounce After 4th Wave Consolidation

If you have been following David Banister this year you know that he has been hitting the cover off the ball with his gold and markets calls. Where does he think gold is headed?


In my most recent few forecasts for subscribers and public articles I’ve discussed a major correction in Gold, and it dropped $208 within 3 days of that forecast several weeks ago as Gold traders will recall. Last week I wrote about further consolidation being required in what I’m seeing as a either 4th wave likely “Triangle Pattern” that will consolidate the 34 month run from $681 to $1910 into August of this year, or a 3 wave “A B C” pattern. We are right now in some form of C wave, it’s just a matter now of confirming if we are going to get a “D and E” wave to follow, or the C wave drops lower before we bottom.

A Triangle pattern serves to let the “economics of the security” catch up with the prior large movement upwards in price. In essence, the crowd behavior pushed the price of Gold a bit too high too fast, and this consolidation pattern lets the fundamentals catch up to price action. We had a parabolic move I discussed many weeks ago, and those always end badly to the downside. The $208 drop in three days is a typical reaction to a spike run like that. At the end of the day though, I had been forecasting what I call a “Wave 3” top and was looking for a multi week or multi month consolidation pattern before Gold could move higher.

Let’s examine what that triangle projection may look like. 

They take the form of 5 waves, or what we can call ABCDE in a pattern. The biggest drop is always the “A” wave, and that was 1910 to 1702 in 3 days or less. The next biggest drop is the “C” Wave, and that was 1920 to 1793, noting it was a Fibonacci 61.8% drop relative to the A wave. In other words, each successive wave down in the 5 wave triangle is smaller. This is due to the sentiment finally shifting and the trading patterns moving from people chasing the hot sector or stock or metal, to the long term investors accumulating the dips.

If we end up consolidating in a “Triangle”, then Gold should end up looking something like the below pattern I drew, with a target of $2,350 per ounce many months out:


The other pattern we are watching for at TMTF is the ABC Correction pattern. We had the A wave down to 1702, which corrected 50% of the move from 1480-1910 in 3 days. Rarely do you get a major move down like that and not get some type of “re-test” of that low, but because the fundamentals for Gold are strong and getting stronger, we are favoring the Triangle pattern still as most likely. With that said, there is a fat and juicy “Gap” sitting in the chart around 1660 on Gold and dropping down there is what a lot of traders are watching. If that were to fulfill, then we will see an ABC correction ending around $1643, and then Gold will begin another multi month rally to new highs:


At The Market Trend Forecast I teach people my crowd behavioral methodologies and give them reliable forecasts in advance so they can be prepared with their investments. Consider working with us and following the SP 500, Silver, and Gold by going to Market Trend Forecast.com You can take advantage of a 33% discount over the next 48 hours as well.


Get David Banisters Free Weekly Index & Commodity Forecast